Insights
Traffic, latency, error rates, and distributed traces for your services.
What is Insights?
Insights is Hostess's built-in observability for your services. It answers the questions you actually ask in production: How much traffic is this service taking? How fast is it responding? What's erroring? And when something is slow, where did the time go?
Insights are on by default. You don't configure a metrics backend, run a collector, or expose a scrape endpoint — Hostess wires all of that up for you. You see data in Studio on each service's Metrics tab.
Insights observes the server side. For what happens in your visitors' browsers — audience analytics and real-user Core Web Vitals — see Web Analytics.
There are two levels of detail, and you choose how far you go.
Level 1 — Basic traffic
Any service that receives traffic through a public Hostess URL gets request volume, latency, and error-rate charts automatically. Nothing to install, nothing to configure.
This works for every web-facing service type, including nextjs, fastapi, static, and custom.
Level 2 — Route-level detail
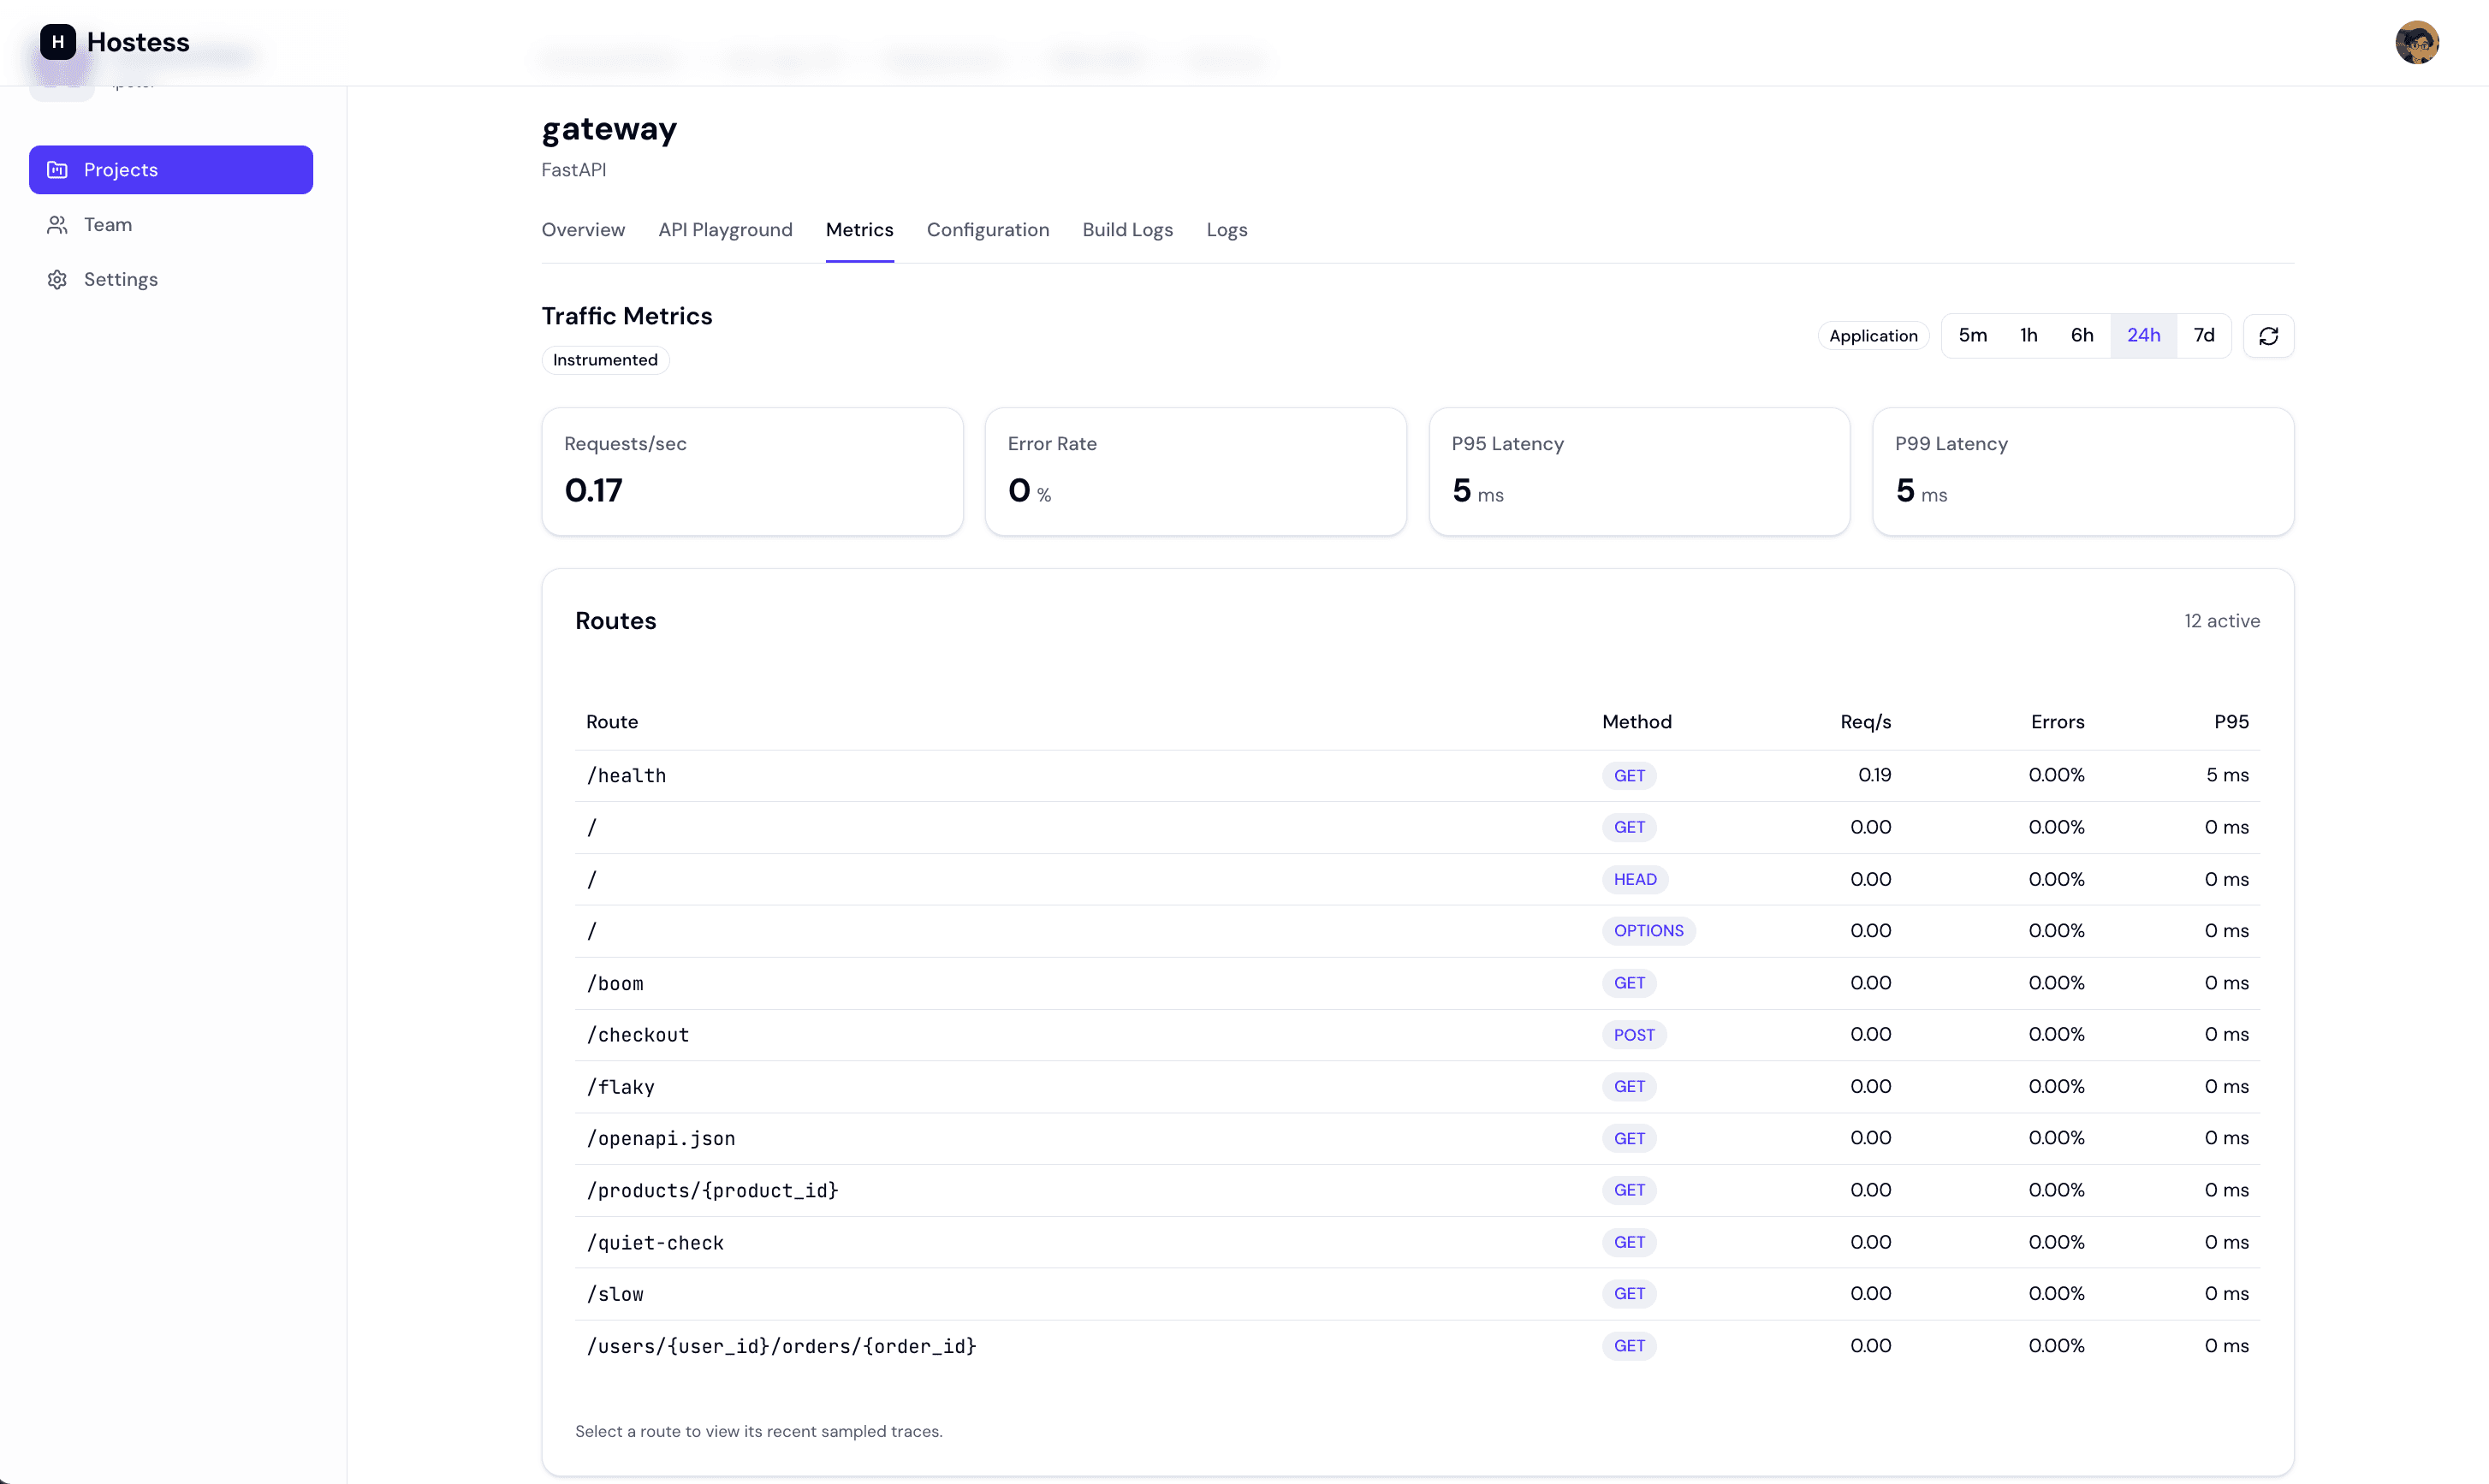
Studio unlocks per-route breakdowns: traffic, latency, and status codes for each route, the exact framework version you're running, and sampled distributed traces you can open as a waterfall.
from fastapi import FastAPI
from hostess_sdk.fastapi import instrument

app = FastAPI()
instrument(app)
See FastAPI → API Insights for Source vs Dockerfile details.
Route-level Insights preconfigure battle-tested OpenTelemetry instrumentation and point it at Hostess — you never deal with OTLP endpoints, collectors, or instrumentation wiring.
Traces
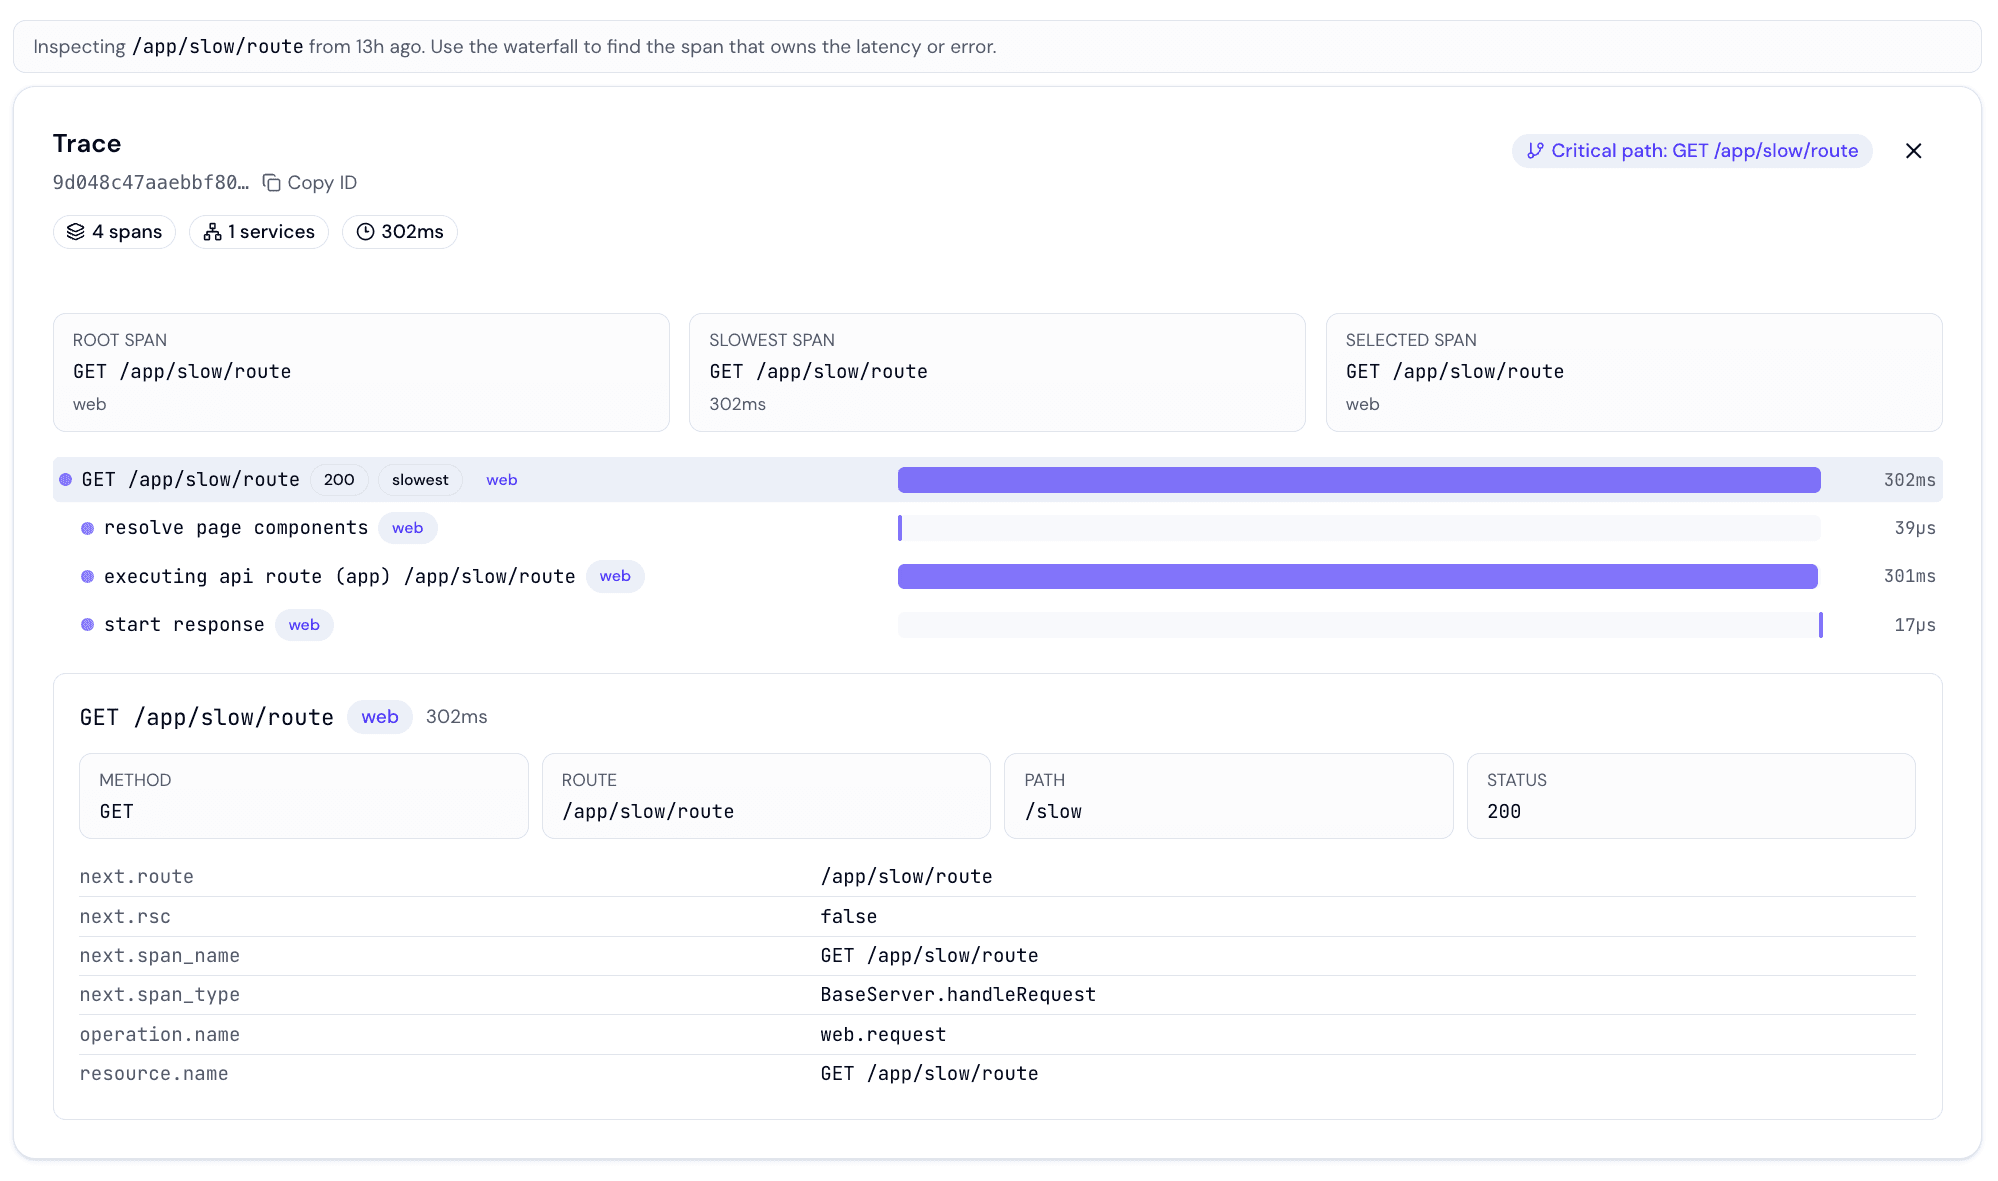
When route-level Insights are active, Hostess retains a sampled subset of your service's requests as distributed traces. From the route table on the Metrics tab, click a route to see its recent traces — sortable by duration, error-first — then click a trace to open the waterfall viewer: a nested span timeline with a per-span attribute panel.
Traces follow requests across services, so a call from your Next.js frontend into a FastAPI backend shows up as one trace spanning both workloads, with each span labeled by the service it ran in.
A few things worth knowing:
- Sampling. Traces are sampled (a fraction of requests are kept) so retention stays cheap. Your traffic and latency metrics are still exact — sampling only affects which individual traces you can open.
- Retention is short. Traces are a debugging tool, not an archive. Older traces age out automatically.
- Resolved paths. Each trace shows both the route template (e.g.
/users/{id}) and the concrete path that was actually hit (e.g./users/42). Query strings are stripped.
Configuration
You never have to configure insights to get them. The only reason to touch config is to turn collection off for a service — for example, a noisy internal worker you don't want in your dashboards.
services:
  web:
    type: nextjs
    insights: disabled          # turn off all insights for this service
Use the object form for finer control:
services:
  web:
    type: nextjs
    insights:
      server: disabled          # no server-side metrics or traces
      browser: disabled         # no browser analytics
When a service's insights.server is disabled, Studio shows a "disabled in hostess.yml" state instead of an install prompt. See the Configuration Reference for the full field list.
What you'll see in Studio
Insights surface on each service's Metrics tab. What appears depends on the service type and whether route-level Insights are active:
| State | What Studio shows |
|---|---|
| Basic | Traffic, latency, and error-rate charts measured at the platform edge. |
| Route-level, waiting | Detected framework version, waiting for the first requests. |
| Route-level and active | Per-route traffic, latency, and status codes; framework version; clickable traces. |