Hostess Studio
The web dashboard for managing your Hostess deployments, services, and configuration.
What is Studio?
Hostess Studio is the web dashboard for the Hostess platform. It gives you a visual interface to manage everything about your deployments — organizations, projects, services, secrets, domains, backups, and more — without touching the CLI.
Studio lives at hostess.sh/dashboard. You can use it alongside the CLI or as your primary management tool. Every action available in the CLI has an equivalent in Studio.
Accessing Studio
To access Studio, navigate to hostess.sh/login. You can sign in with email + OTP or GitHub OAuth.
Once authenticated, you are taken to the dashboard where you can see all the organizations you belong to and switch between them.
hostess login opens a one-time Studio approval page. A token from hostess login and a Studio session are different mechanisms, but they represent the same user and organization membership.
Organizations
Organizations are the top-level container for everything in Hostess. Every project, team member, and billing plan belongs to an organization.
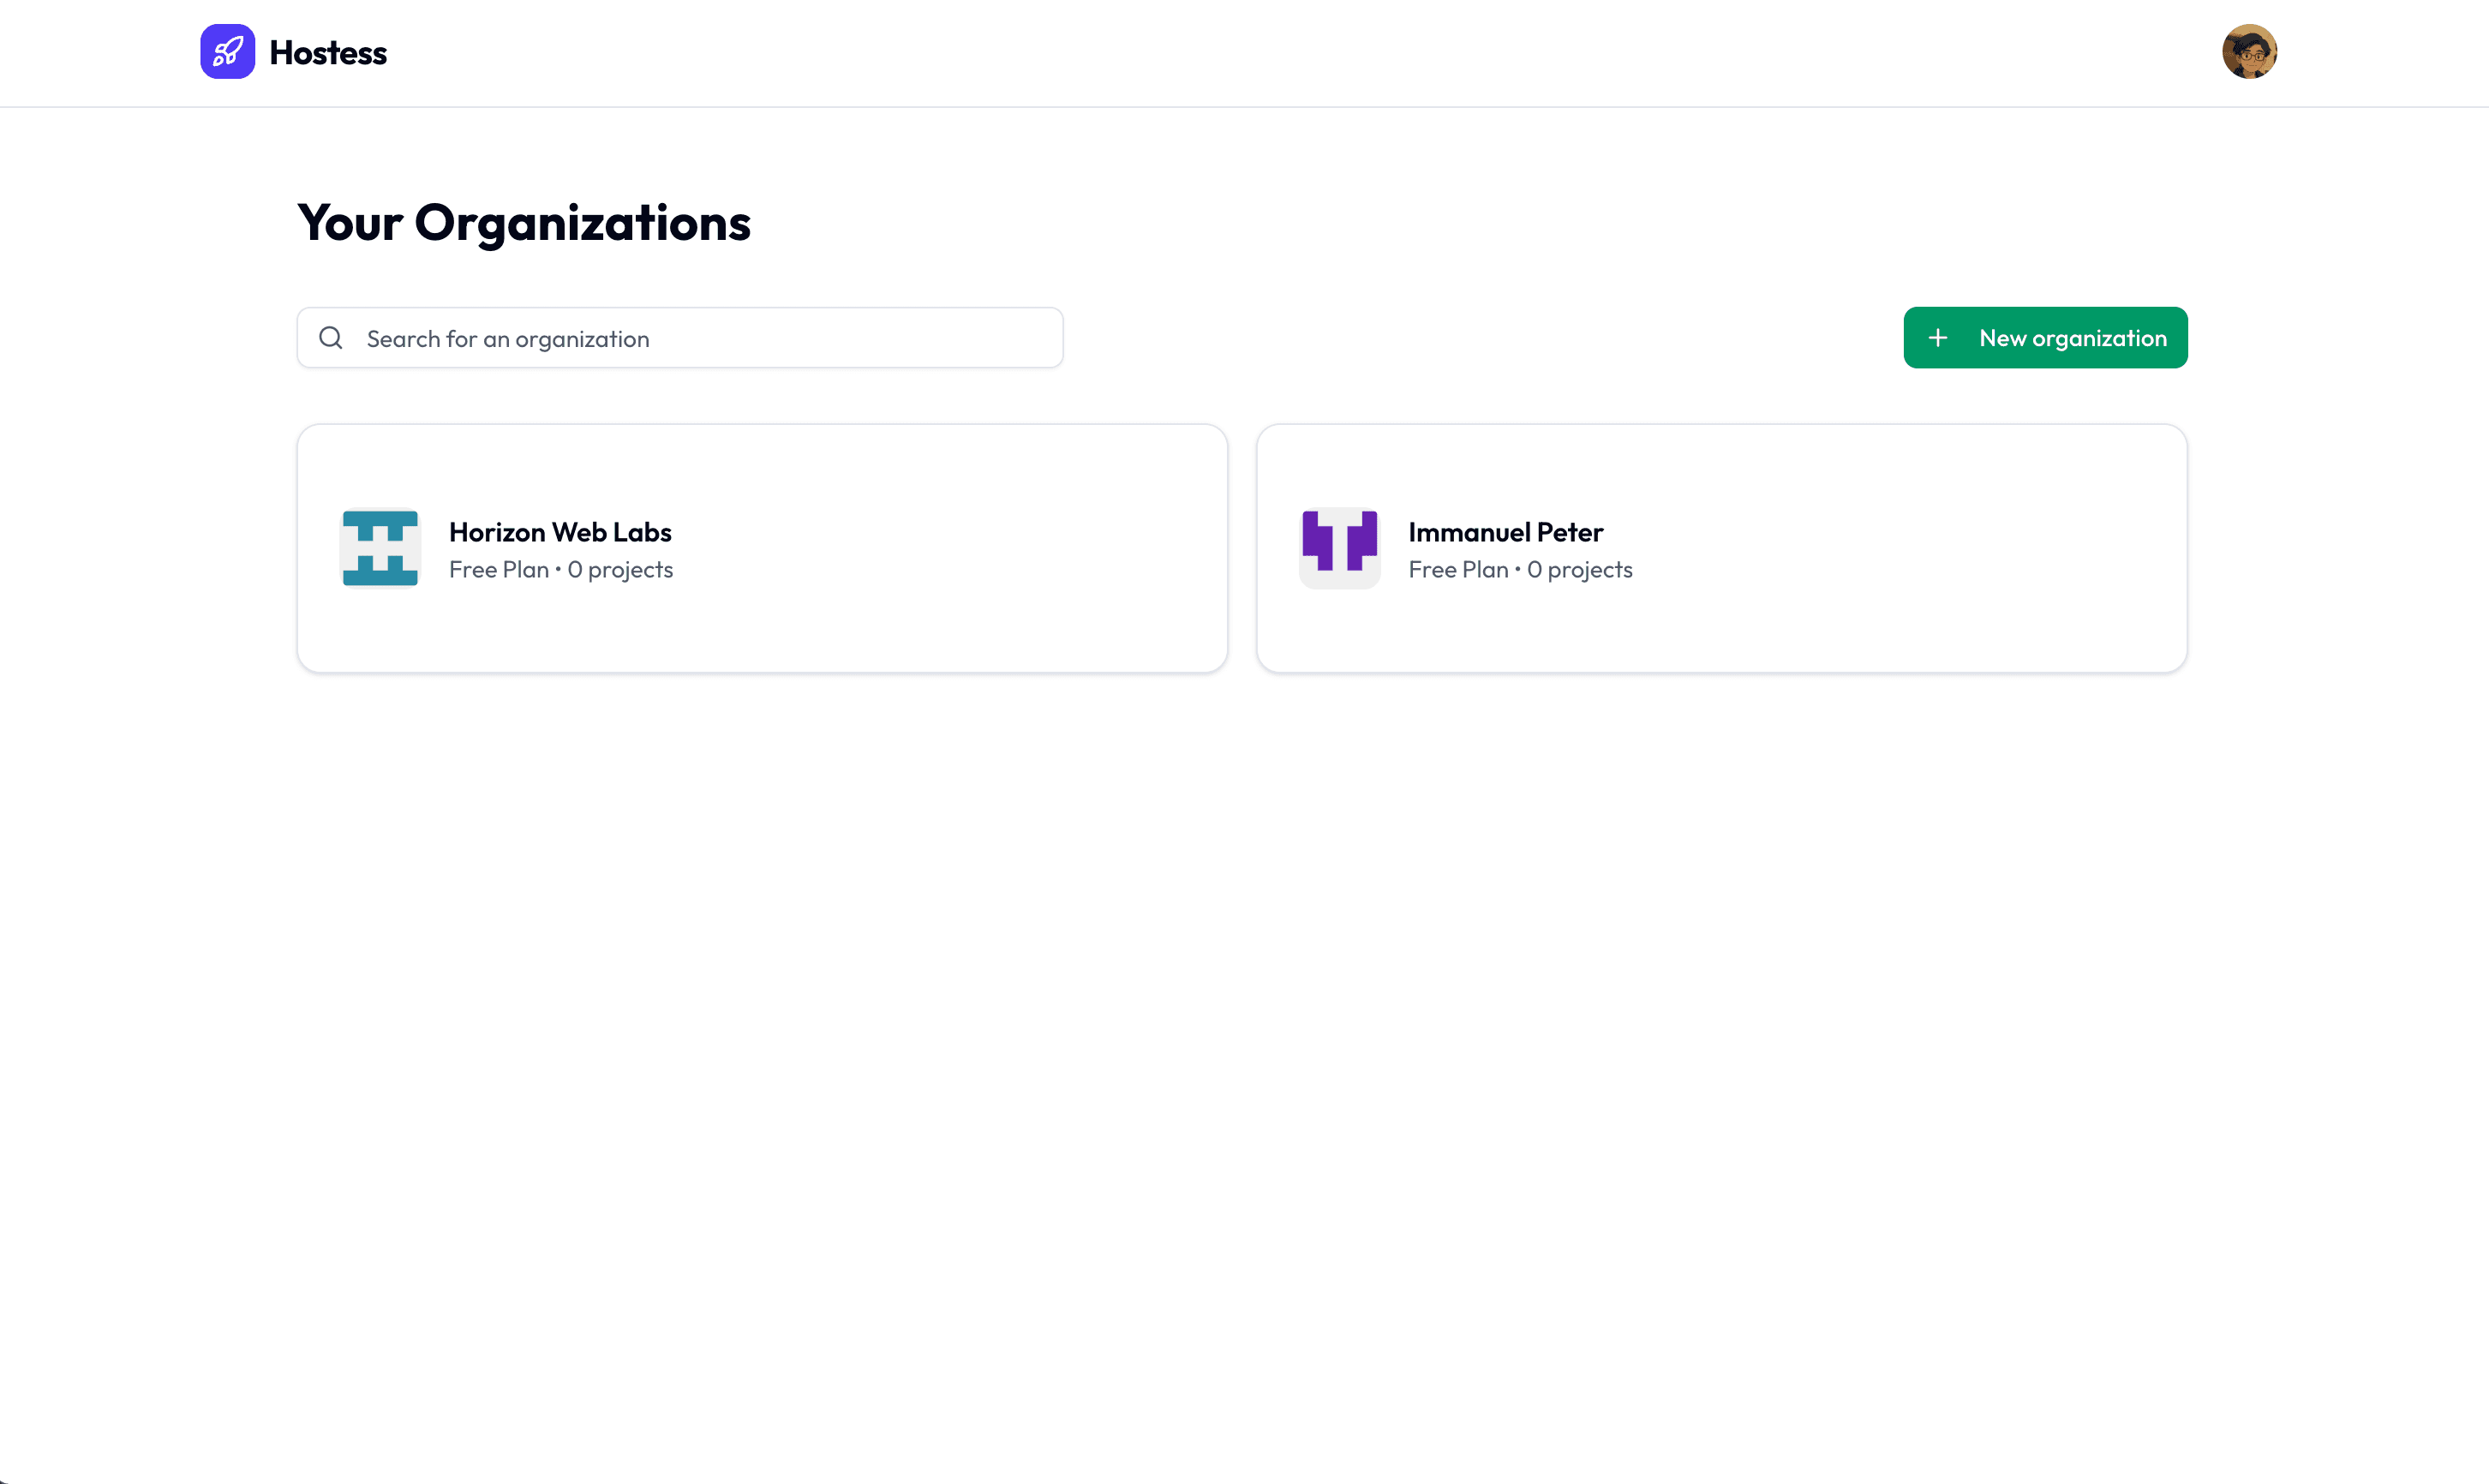
Creating an Organization
To create a new organization:
- Click the organization switcher in the top-left corner of the dashboard.
- Select New Organization.
- Enter a name and an optional description for the organization.
- Click Create Organization.
Switching Organizations
If you belong to multiple organizations, use the organization switcher in the top-left corner of the dashboard. Click it to see a list of all organizations you are a member of, and select the one you want to view.
Team Management
The Team page lets you manage who has access to your organization and what they can do. Navigate to it from the sidebar under your organization.
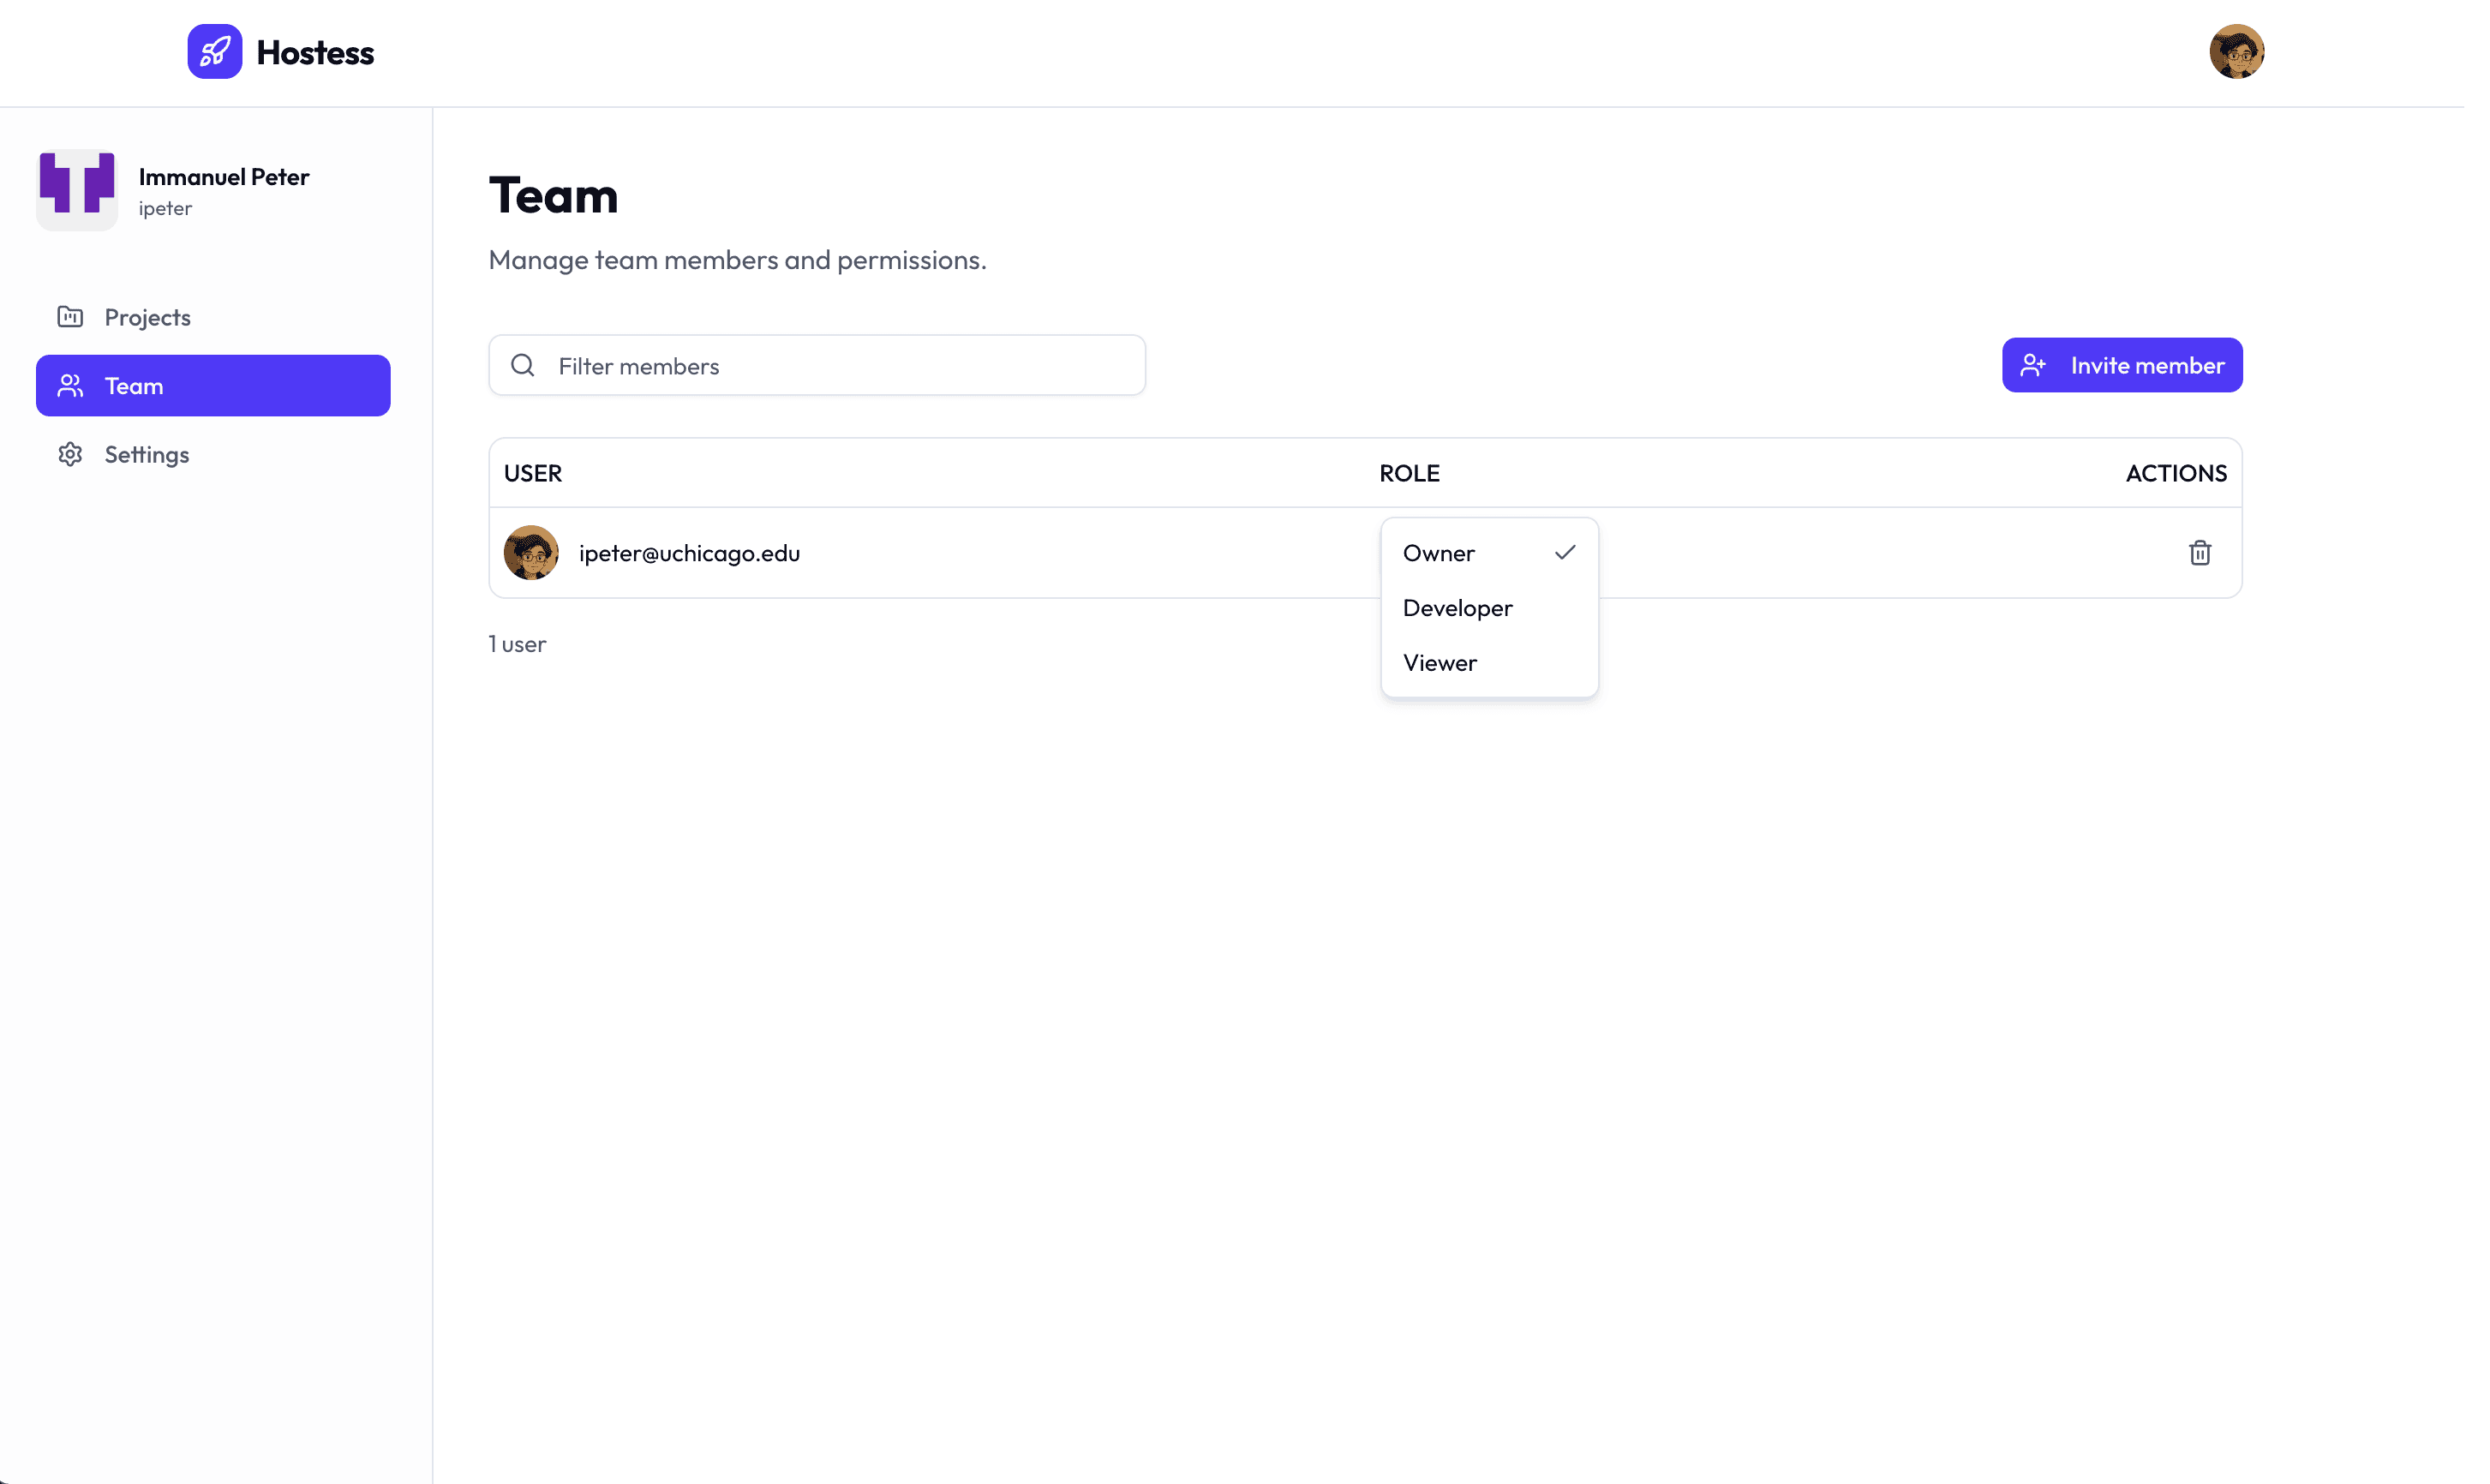
Inviting Members
- Go to Team in the sidebar.
- Click Invite Member.
- Enter the email address of the person you want to invite.
- Select a role for the new member.
- Click Send Invitation.
The invited person receives an email with a link to accept the invitation. Once they accept, they appear in the team members list.
Roles
Hostess uses role-based access control to manage permissions within an organization. There are three roles:
| Role | Description | Permissions |
|---|---|---|
| Owner | Full control over the organization | Create/delete projects, manage team members, manage billing, deploy, manage secrets, manage domains, manage environments |
| Developer | Build and deploy access | Create projects, deploy, manage secrets, manage domains, manage environments, view logs and metrics |
| Viewer | Metadata-only access | View organizations, projects, deployments, service status, metrics, and sanitized configuration. Cannot view logs, build logs, secret values, live database/Redis data, job logs, or run operational actions. |
Every organization must have at least one owner. The person who creates the organization is automatically assigned the owner role.
Removing Members
To remove a member from the organization:
- Go to Team in the sidebar.
- Find the member in the list.
- Click the Remove icon next to their name.
- Confirm the removal in the dialog.
Changing Roles
To change a member's role:
- Go to Team in the sidebar.
- Find the member in the list.
- Use the role dropdown next to their name to select a new role.
- The change takes effect immediately.
Organization Settings
The Settings page for your organization lets you update the organization name, description, and other administrative settings. Navigate to it from the sidebar.
Projects
Projects are the core unit in Hostess. Each project corresponds to one hostess.yml configuration file — your entire application stack. Projects live inside organizations and contain all your deployments, services, secrets, and domains.
Creating a Project
To create a new project in Studio:
- Navigate to your organization's dashboard.
- Click Create Project.
- Enter a project name.
- Optionally add a display name and description.
- Click Create Project.
You can also create projects directly from the CLI during your first deploy. If you run hostess deploy and the project does not exist yet, Hostess prompts you to create one interactively.
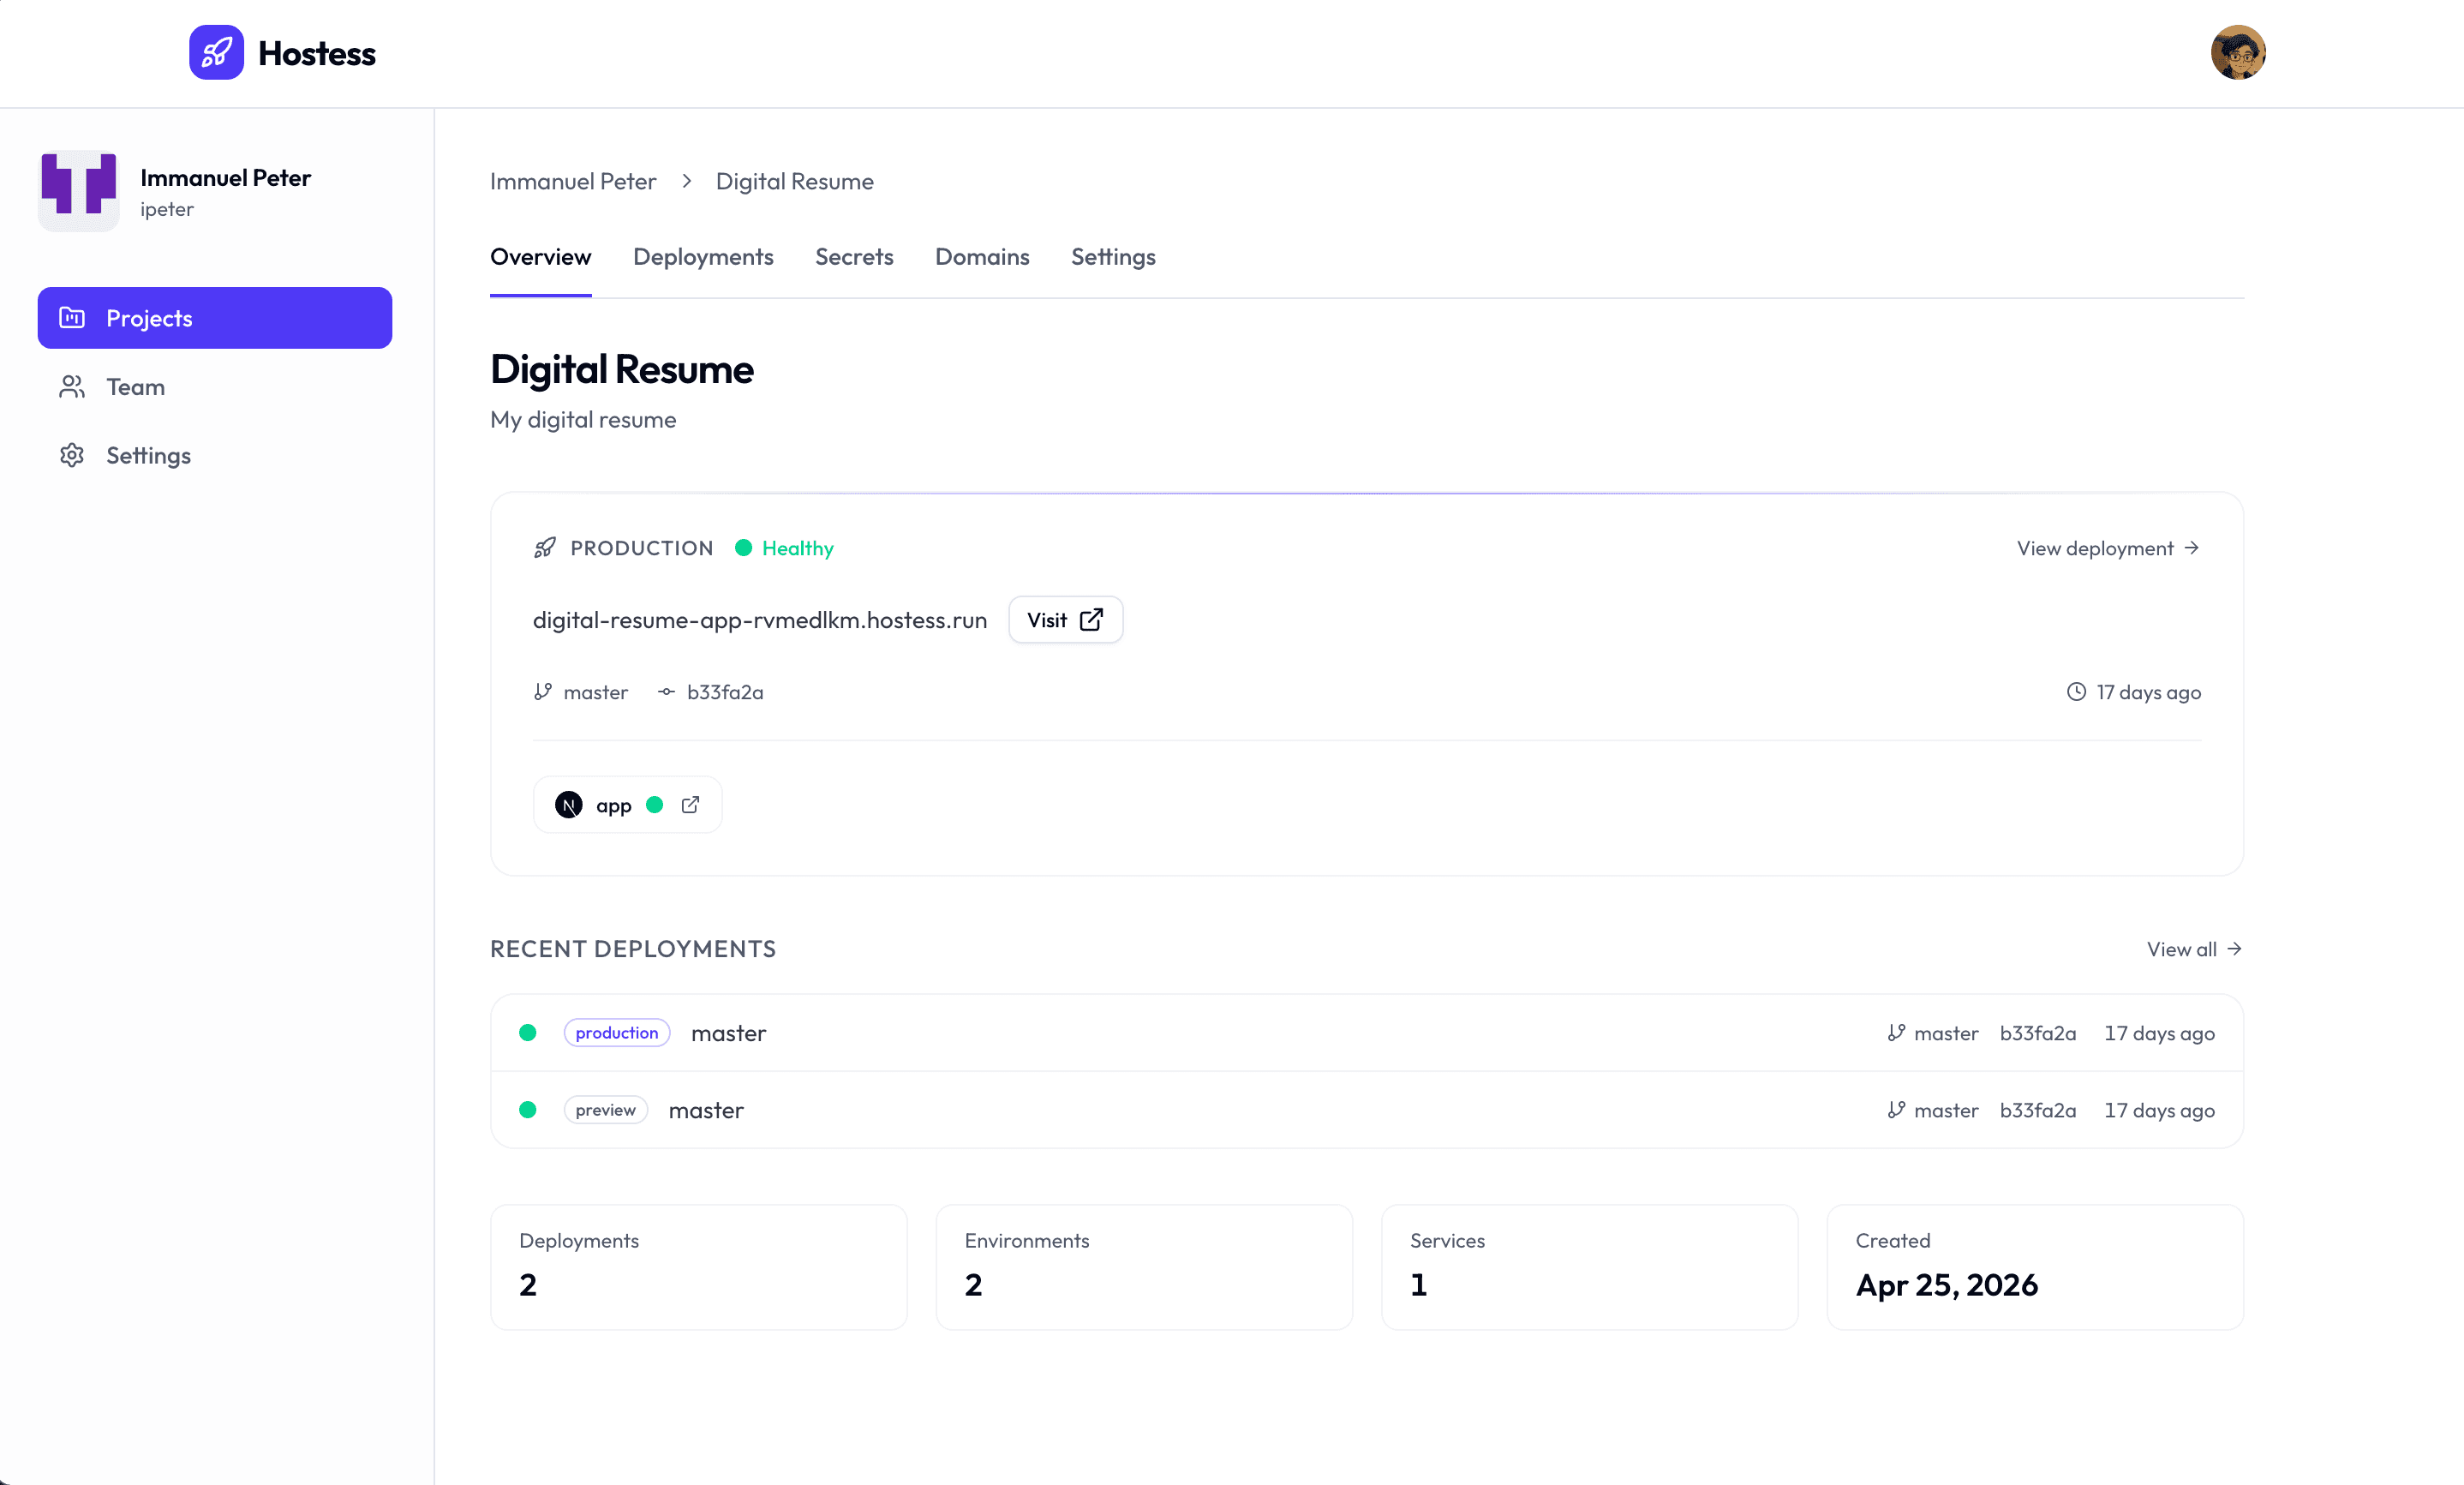
Project Dashboard
The project dashboard is the project overview page. It focuses on the latest production deployment, recent deployment activity, and high-level counts. It shows:
- Latest production deployment — The production deployment status, primary URL, branch, commit SHA, commit message, and relative deployment time.
- Production services — A compact strip of services from the latest production deployment, with service type icons, status indicators, and links for web-facing services.
- Recent deployments — The latest deployments with environment badges, status indicators, commit messages or branch names, git metadata, and relative timestamps.
- Project stats — Counts for deployments, environments, and services, plus the project creation date.
Project Settings
Navigate to Settings in the project sidebar to:
- Update the project name and description.
- View the project ID.
- Delete the project.
Deployments
The Deployments page shows a chronological list of all deployments in your project. Each entry displays:
- Environment — The environment name for the deployment, shown as a badge.
- Status — A status dot and label indicating the deployment state.
- Commit message — The git commit message when available, or
Manual deploymentwhen there is no commit message. - Git metadata — The branch and short commit SHA when available.
- Timestamp — When the deployment was initiated, shown as a relative time (e.g., "3 minutes ago").
- Initiator — The triggering user's avatar when available. The user's name is available as hover/title text when Studio has it.
- Actions — A Cancel control while a deployment is in progress, and a Delete control (with confirmation) for any deployment. Both follow your role in the organization — viewers see the list without these controls.
Deployment Detail
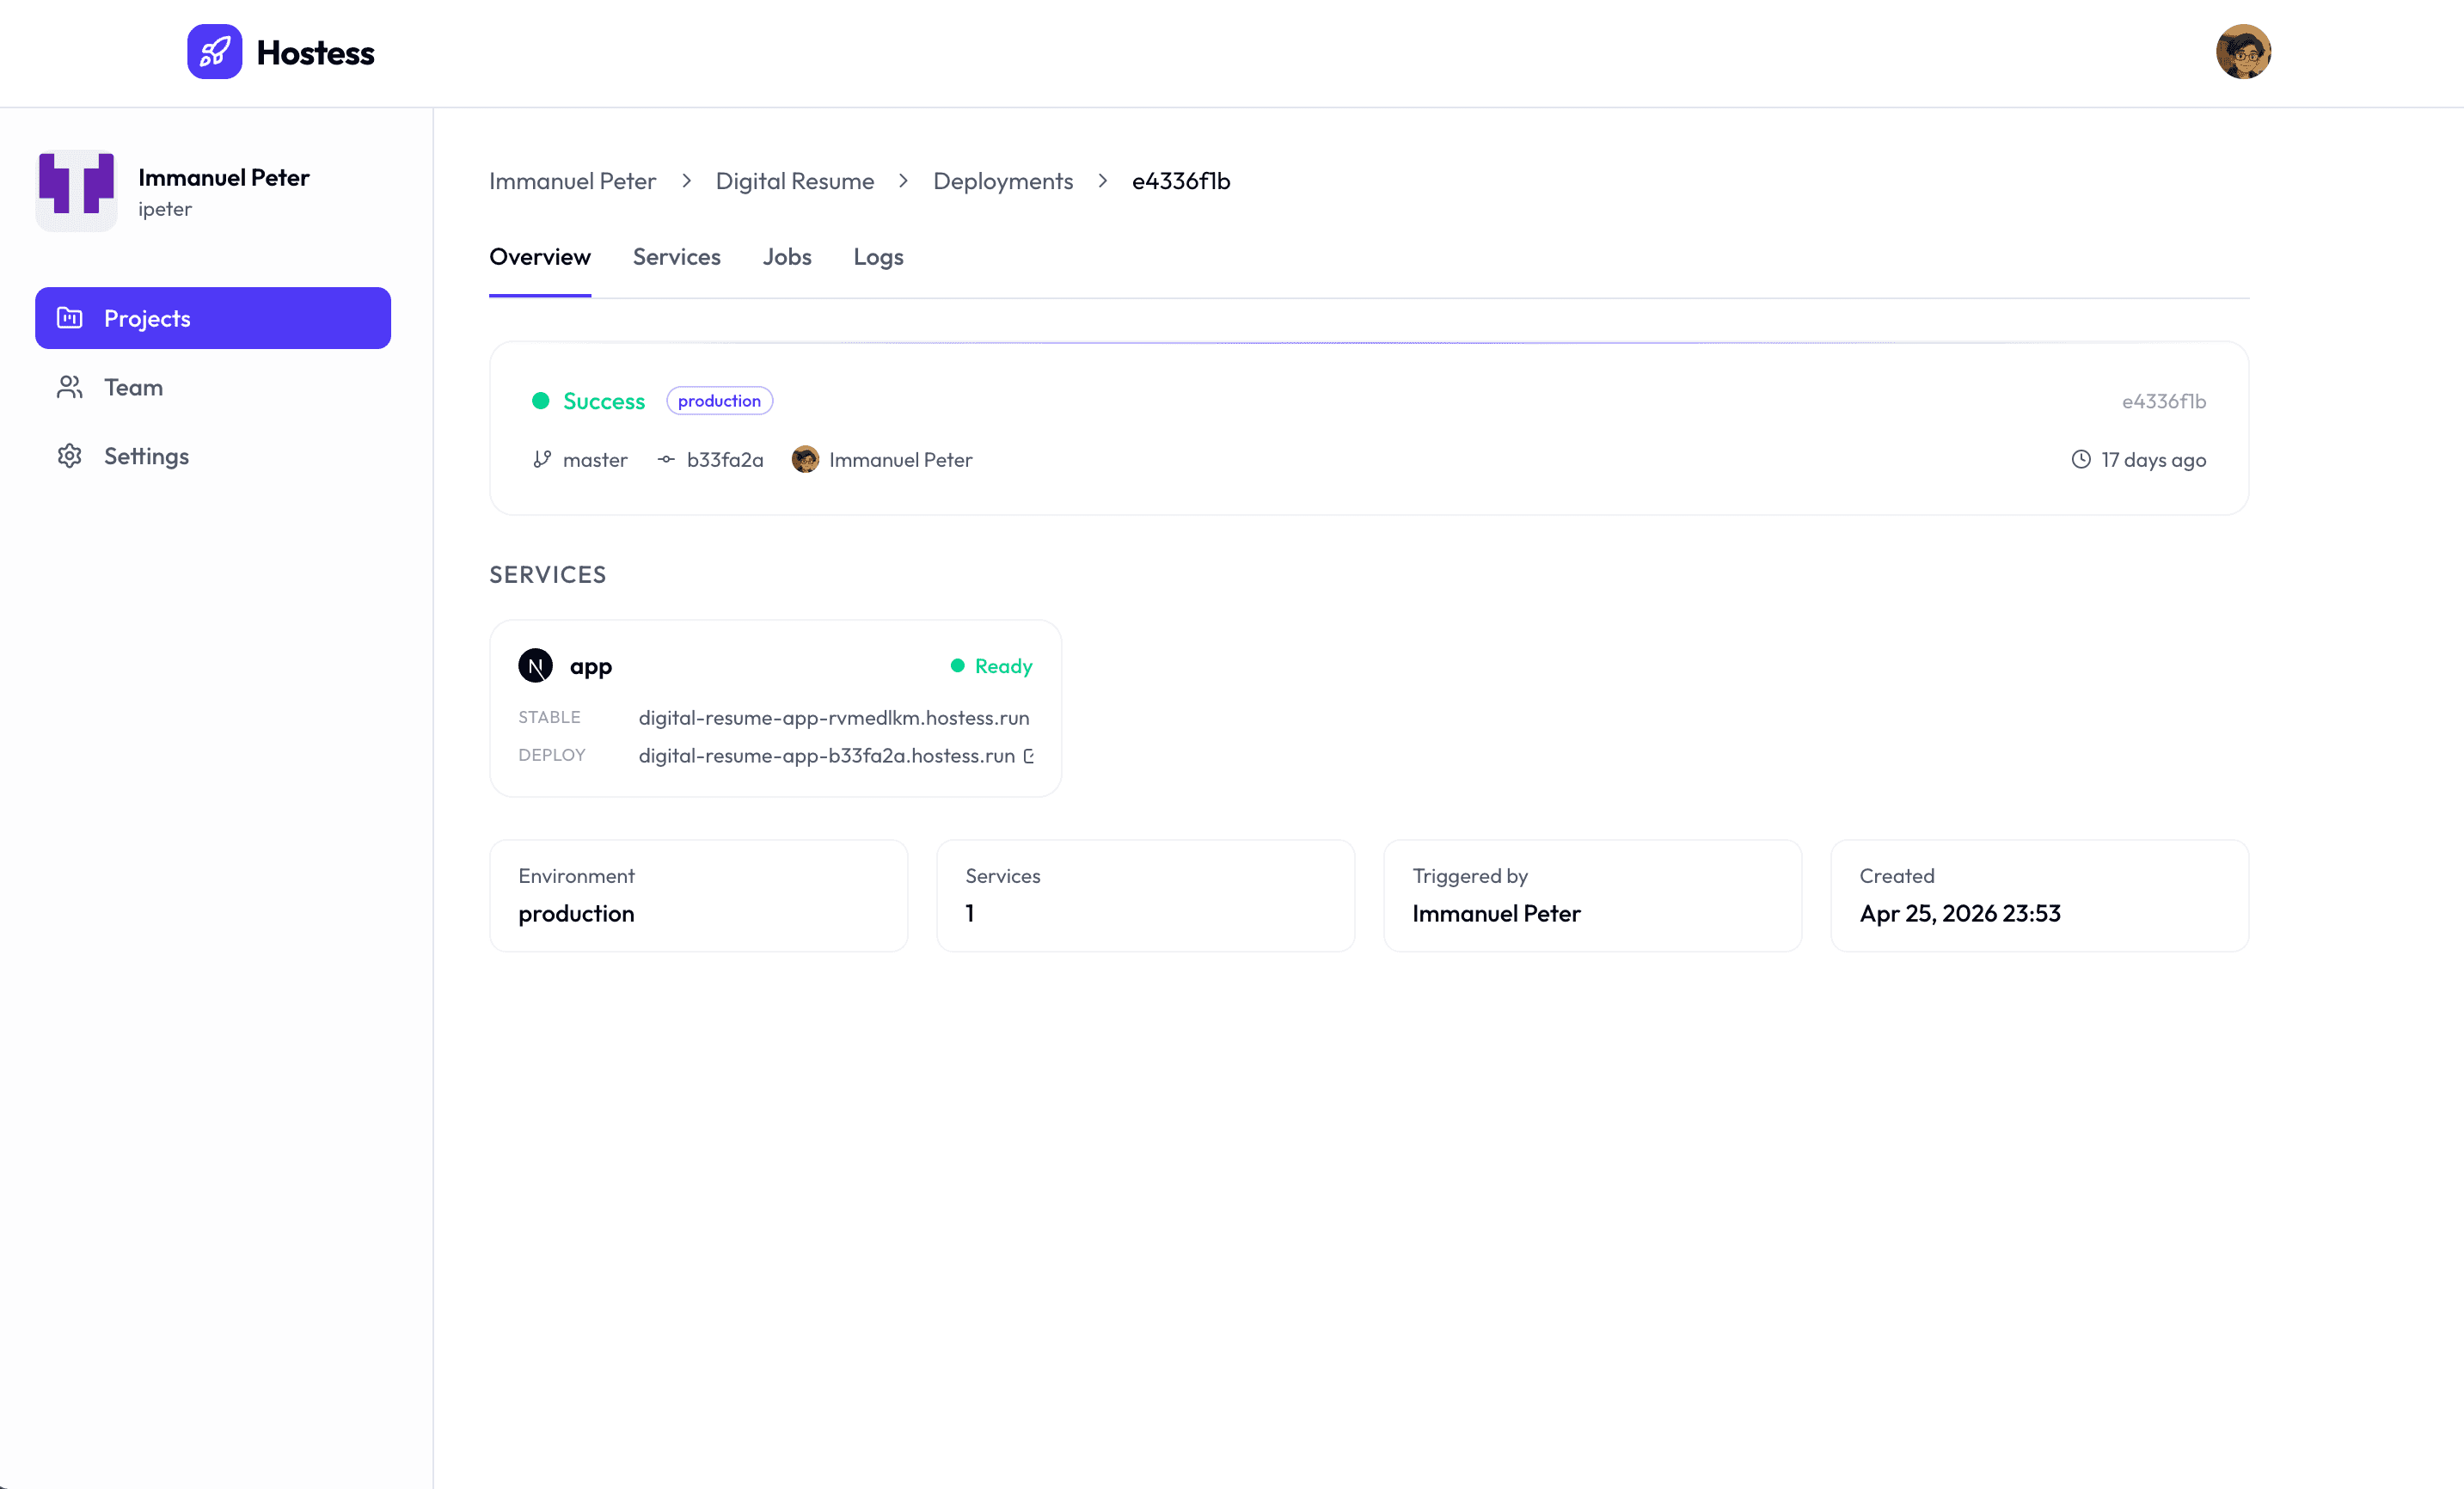
Click on any deployment to see its full detail page. The deployment detail shows:
- Deployment status — The current deployment state, environment badge, deployment ID prefix, and progress bar while a deployment is in progress.
- Git information — Branch, short commit SHA, and commit message when available.
- Initiator and timestamp — The user who triggered the deployment and the relative time it was created.
- Services — Service cards with type icons, individual status indicators, and links to each service detail page.
- Service URLs — Stable and deployment-specific URLs for web-facing services when available.
- Deployment metadata — Environment name, service count, triggering user, and creation timestamp.
Environments
The Environments page shows every deployment target in your project — production, preview, staging, or any custom stage — and what's currently live in each. Navigate to it from Environments in the project sidebar.
Each environment is a card showing:
- Type — A Production or Preview badge, plus a Protected badge when the environment's branches are protected.
- Branch mapping — "Deploys from
main" for an exact branch, or "Matchesrelease/*" when the environment tracks a glob pattern. - Live services — The services currently running in the environment, each with its status, latest commit SHA, deploy age, and URL.
- TTL — For ephemeral environments, a countdown to expiration and whether auto-delete is on.
- Custom domains — Any domains routed to this environment, linking through to the Domains page.
Preview environments (created per pull request) collapse into a Previews section so the page stays readable as PRs come and go.
Creating and Editing an Environment
- Click New Environment, or the pencil icon on an existing environment's card to edit it.
- Set a name and comma-separated branch patterns (e.g.
release/*). - Toggle Ephemeral to reveal TTL and auto-delete options for short-lived environments.
- Optionally mark the environment's branches as protected.
- Save.
Deleting an Environment
Click the trash icon on an environment's card and confirm. This permanently removes the environment, its secrets, deployment history, and running services. The production environment is protected and can't be deleted.
Services
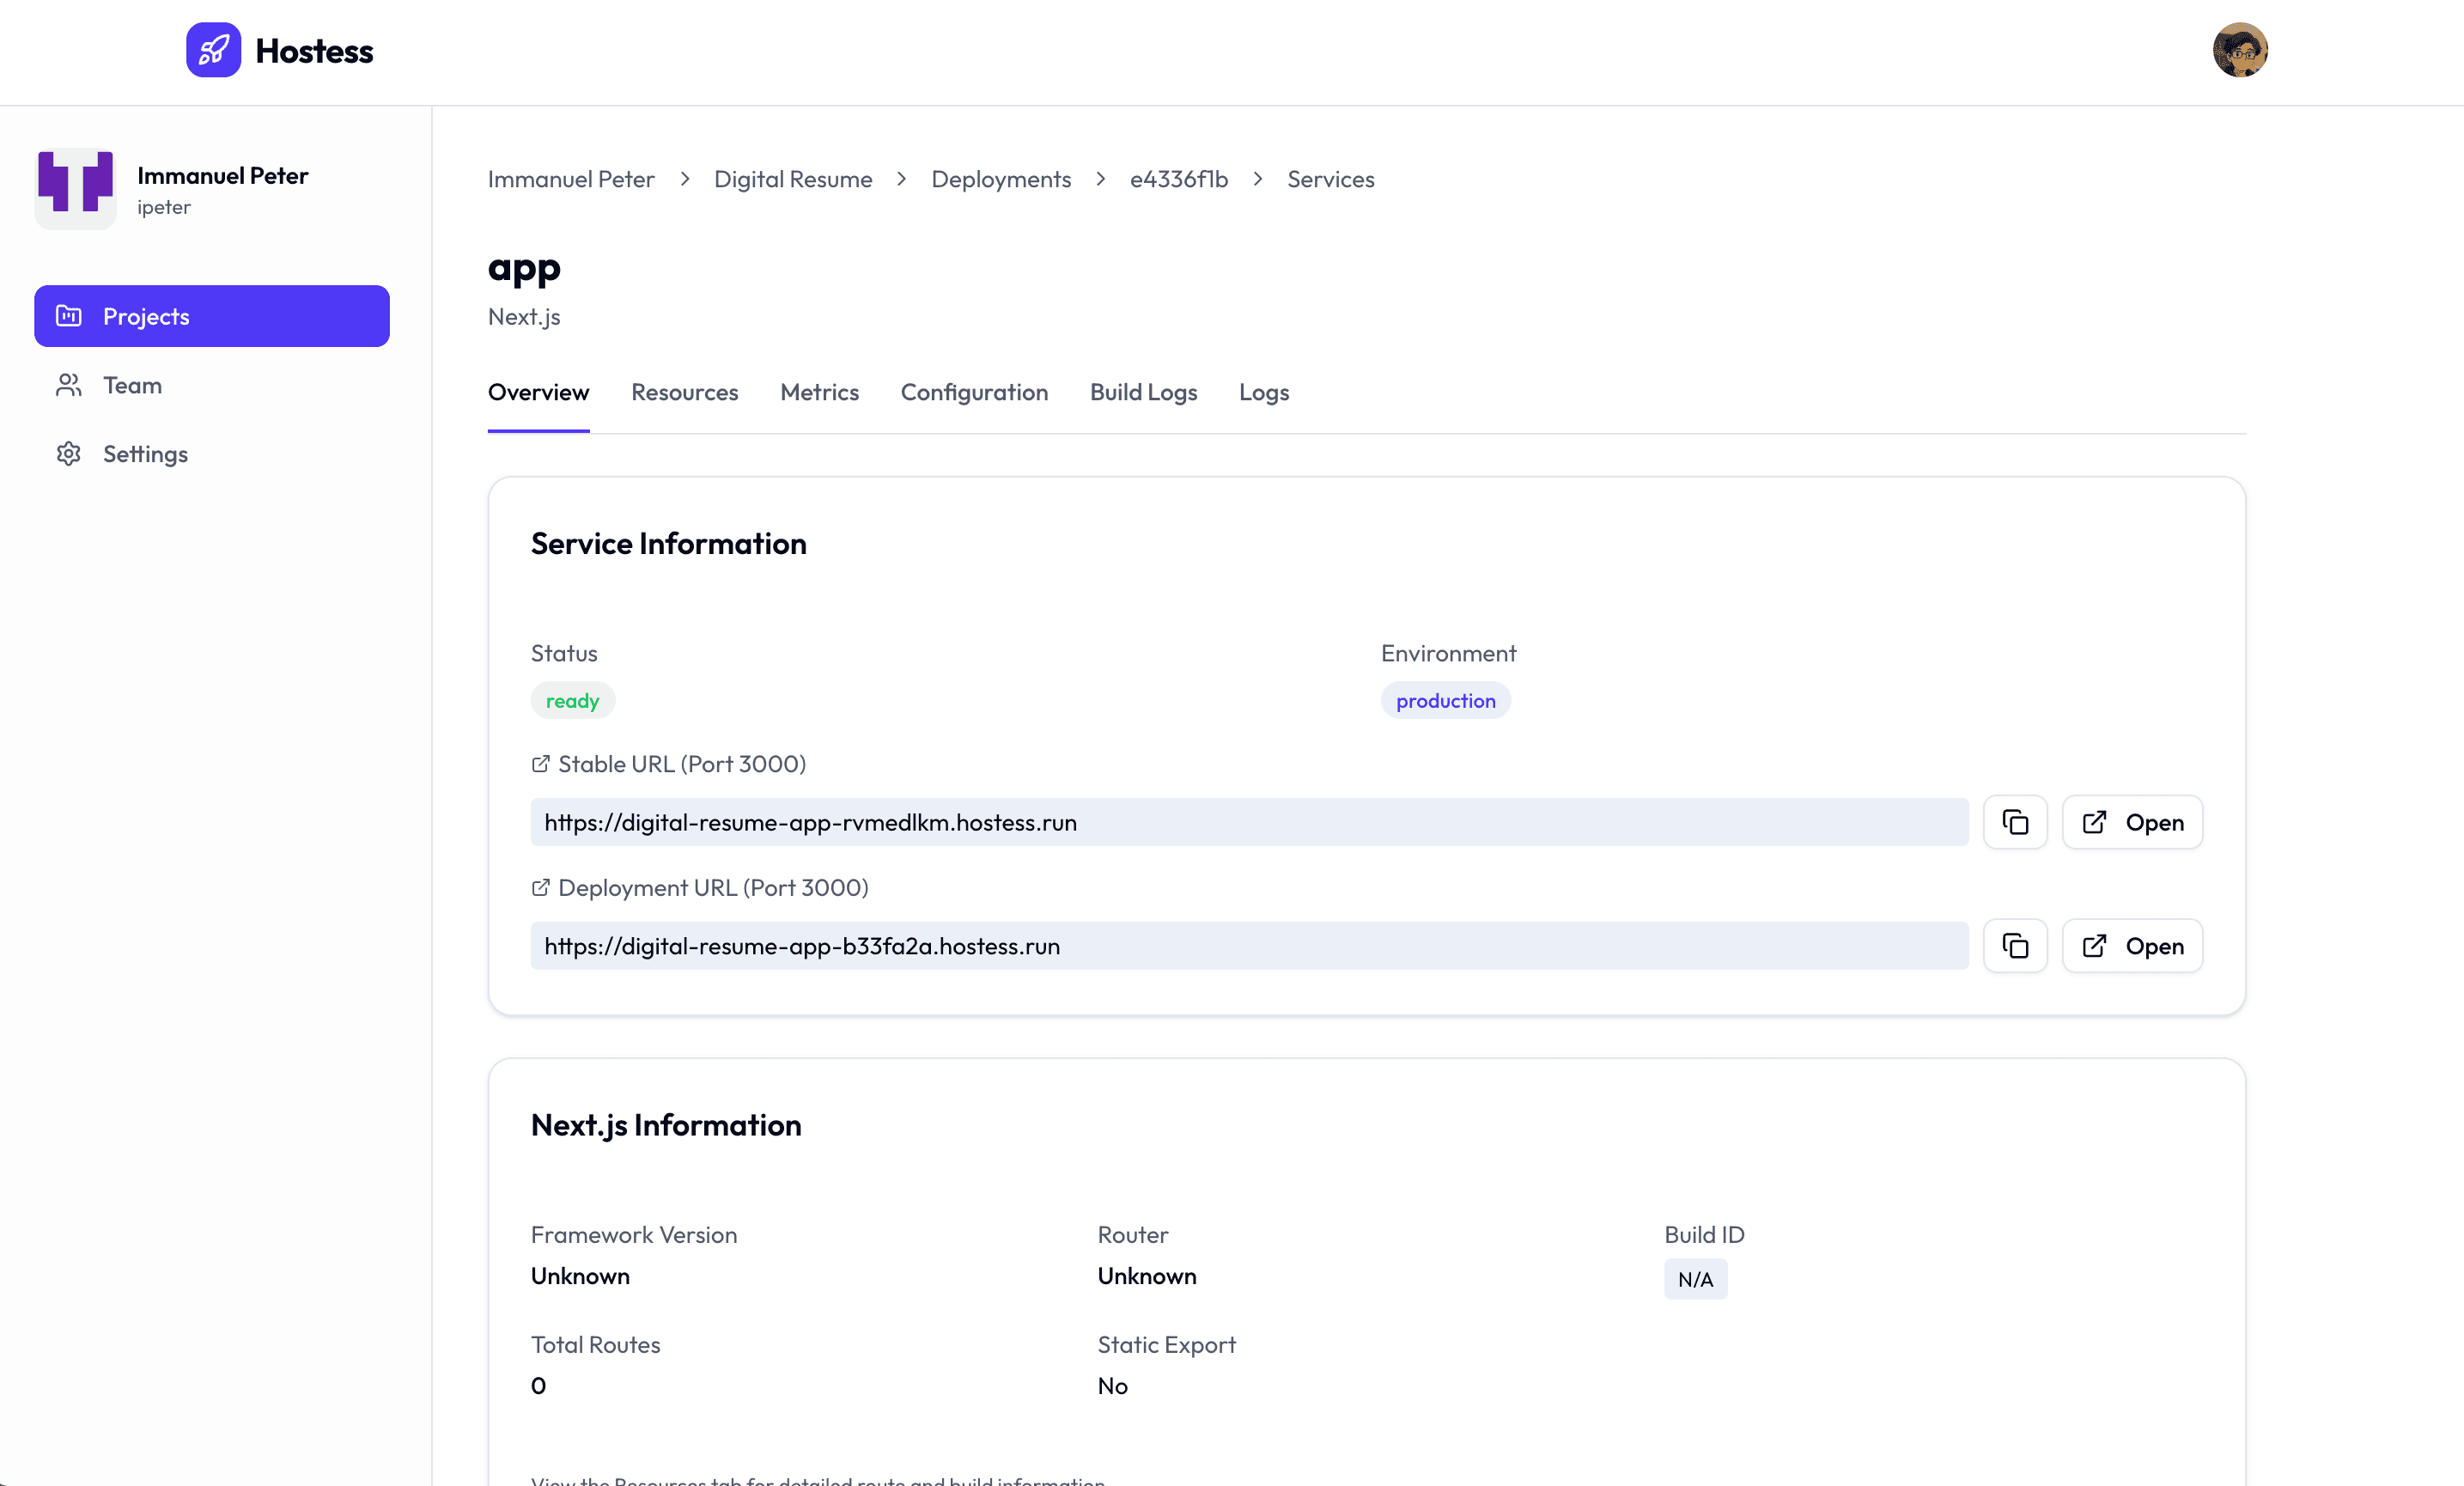
The Services section is accessible from a deployment detail page. Select a service to open its detail page, where Studio shows the service overview and the tabs that apply to that service type.
Service Overview
The service overview page summarizes the service in the context of the selected deployment:
- Service information — Status, environment, service errors, and external URLs for web-facing services.
- Access — On services with team-level visibility, recent signed-in allowed and denied activity, plus a collapsible summary of unauthenticated traffic. See Service Visibility.
- Build information — Build status, duration, start time, and completion time for services built from source.
- Deployment reference — Deployment ID, deployment status, git branch, and short commit SHA.
- Type-specific details
- Next.js services show framework and route details
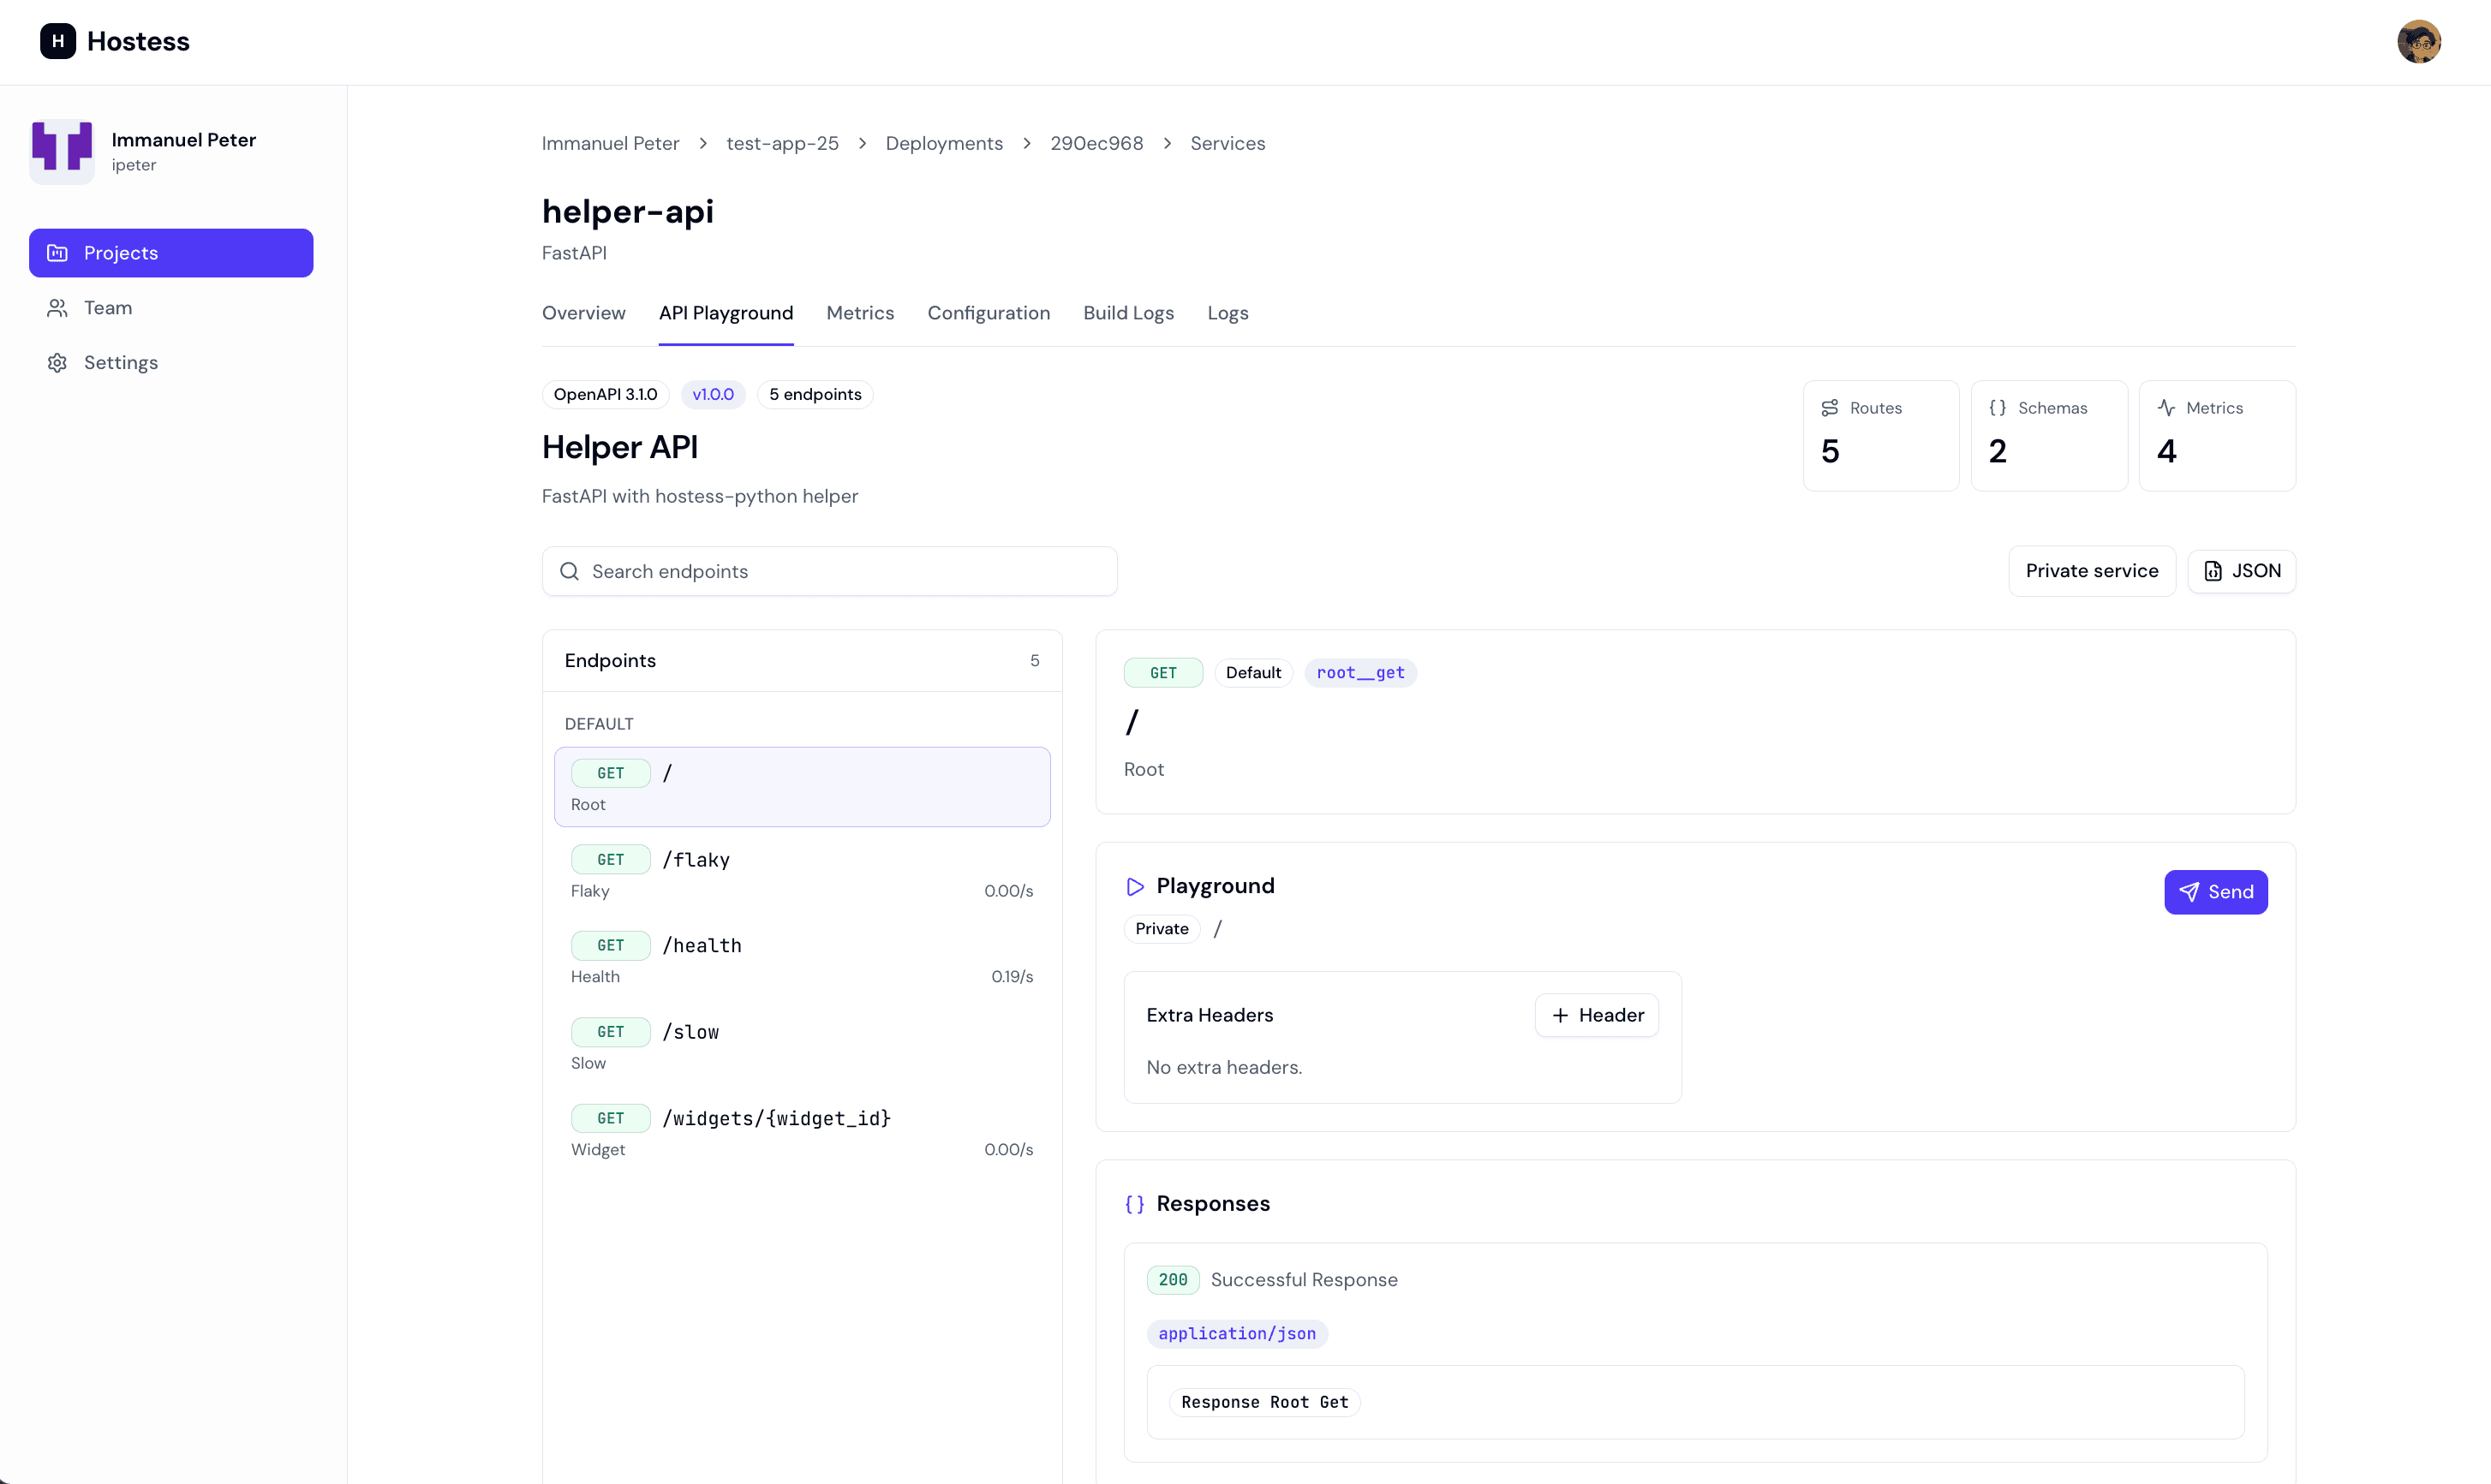
- FastAPI services include API documentation and an interactive API explorer
- Database services show public connection strings, local connection guidance, and database group information
API Explorer (FastAPI)
FastAPI services have an API Docs view that renders the service's OpenAPI schema as browsable documentation and an interactive playground. You can expand any endpoint, fill in parameters and a request body, and send the request through Studio — calls are proxied so you can exercise your API without leaving the dashboard.
Real-Time Logs
The Logs tab streams service logs and provides controls for reading and exporting output:
- Search — Filter logs by keyword.
- Pause/Resume — Pause the log stream to read through output without it scrolling away.
- Auto-scroll — Keep the view pinned to the newest log lines.
- Clear — Clear the current in-browser log buffer.
- Download — Export the current log output for offline analysis.
Log access follows organization role permissions.
Metrics
The Metrics tab uses the service type to choose the right dashboard:
- Application services — Generic services show CPU and memory cards and charts.
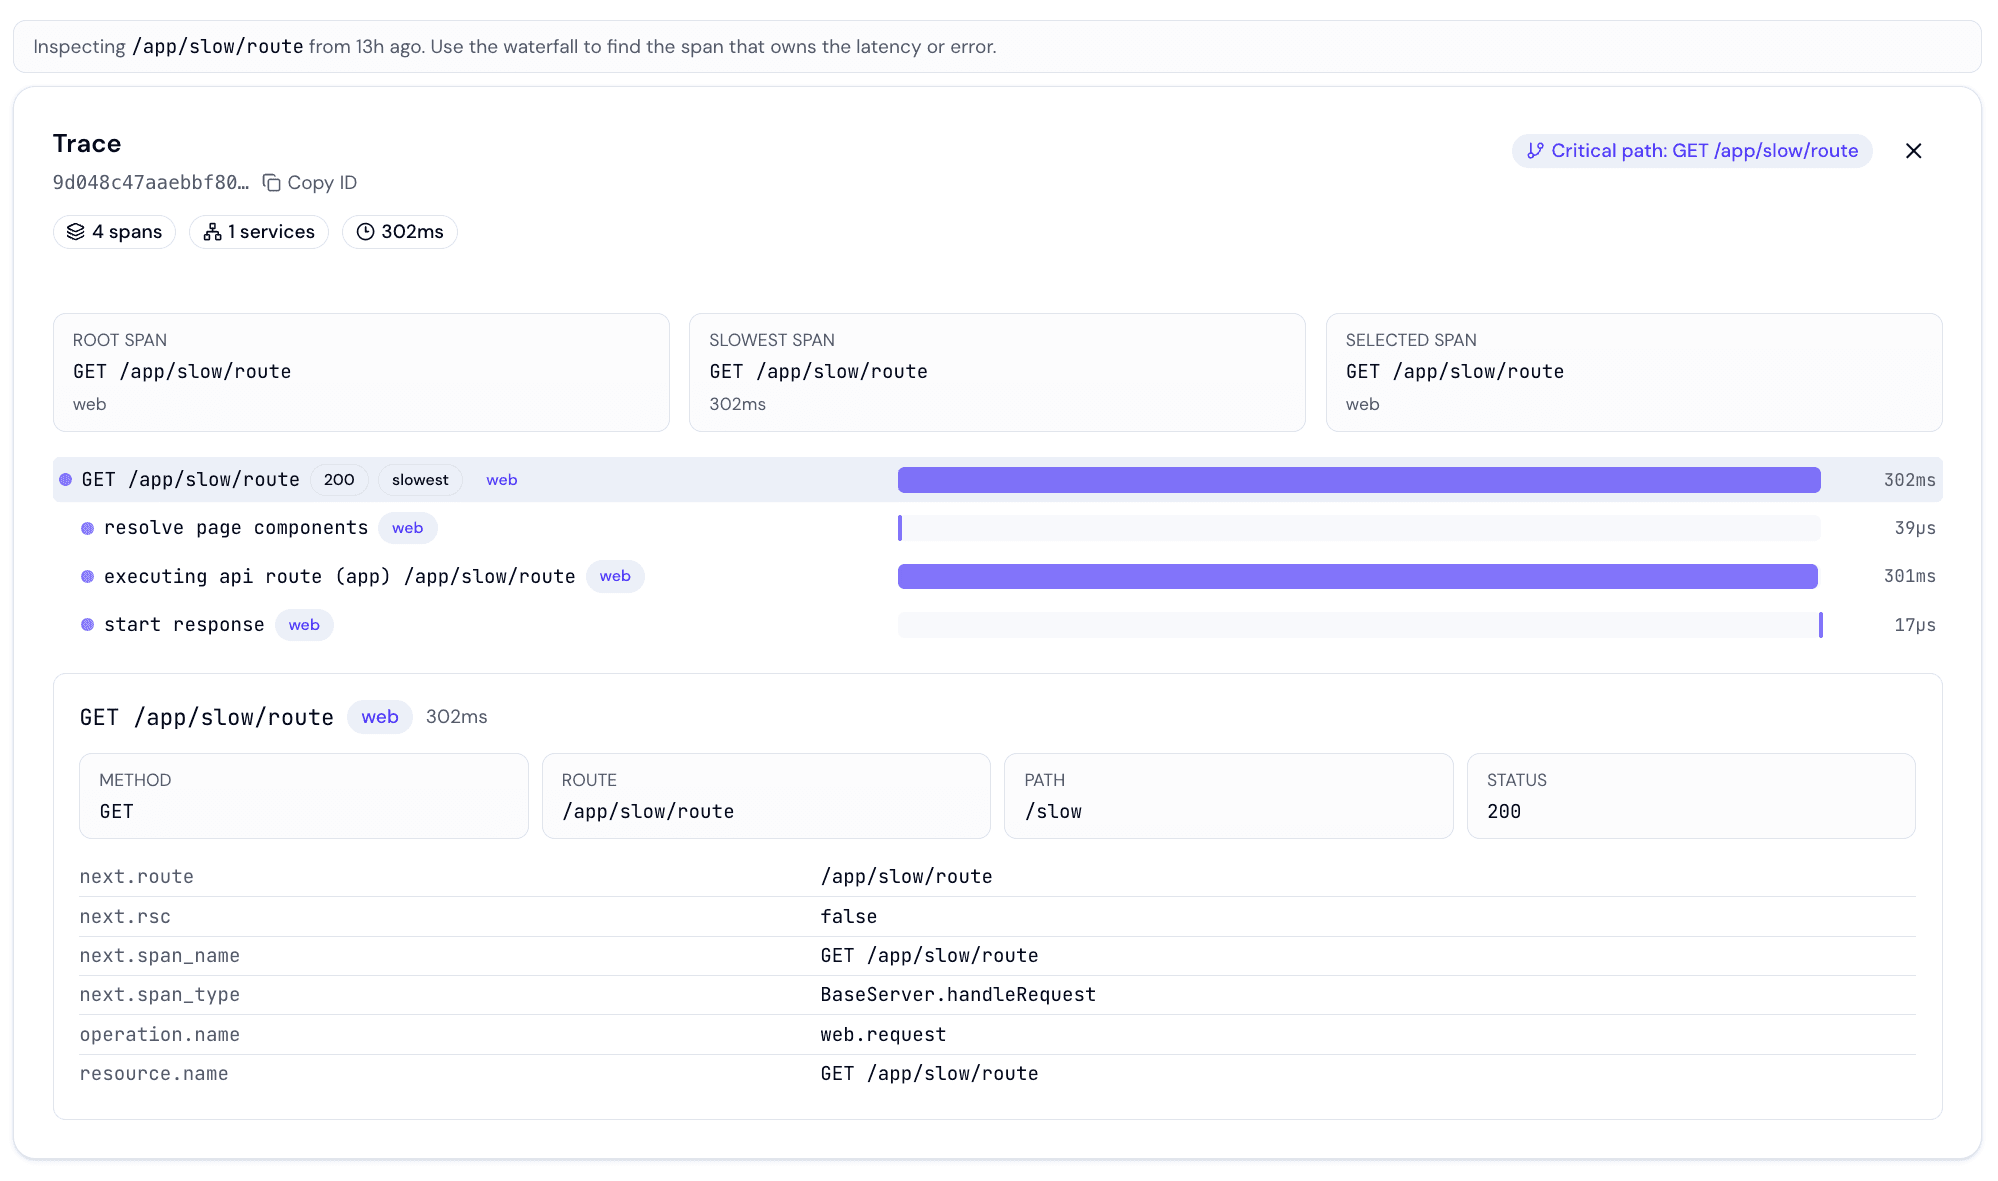
- Next.js and FastAPI services — Web services show traffic-oriented Insights dashboards: request volume, latency, and error rate. When the Hostess helper is installed, the dashboard adds a route-level traffic table (per-route traffic, latency, and status codes) and a badge showing the detected framework version. Click a route to drill into recent traces, then open a trace as a span waterfall. See Insights for the full feature.
- Postgres and Redis services — Database services show database-specific operational metrics.
Insights are on by default for web-facing services. The route-level table, framework badge, and traces appear once you add the framework helper — see FastAPI → API Insights and Next.js → API Insights.
Analytics
The Analytics tab shows privacy-friendly audience analytics for web services instrumented with the Hostess SDK: visitors, page views, and bounce rate with change vs. the previous period, traffic over time, and breakdowns by page, referrer and UTM parameters, country, and client (device / browser / OS). Range controls cover 24 hours to 90 days. See Web Analytics for setup and what's collected.
Speed Insights
The Speed Insights tab shows real-user Core Web Vitals (LCP, INP, CLS, FCP, TTFB) for instrumented web services, filterable by device class and percentile (P75–P99), with per-route detail and the Real Experience Score — a 0–100 score computed from what your visitors actually experienced. Metrics appear once enough samples accumulate; see Web Analytics → Speed Insights.
Configuration
The Configuration tab shows the service's current configuration as applied during the last deployment:
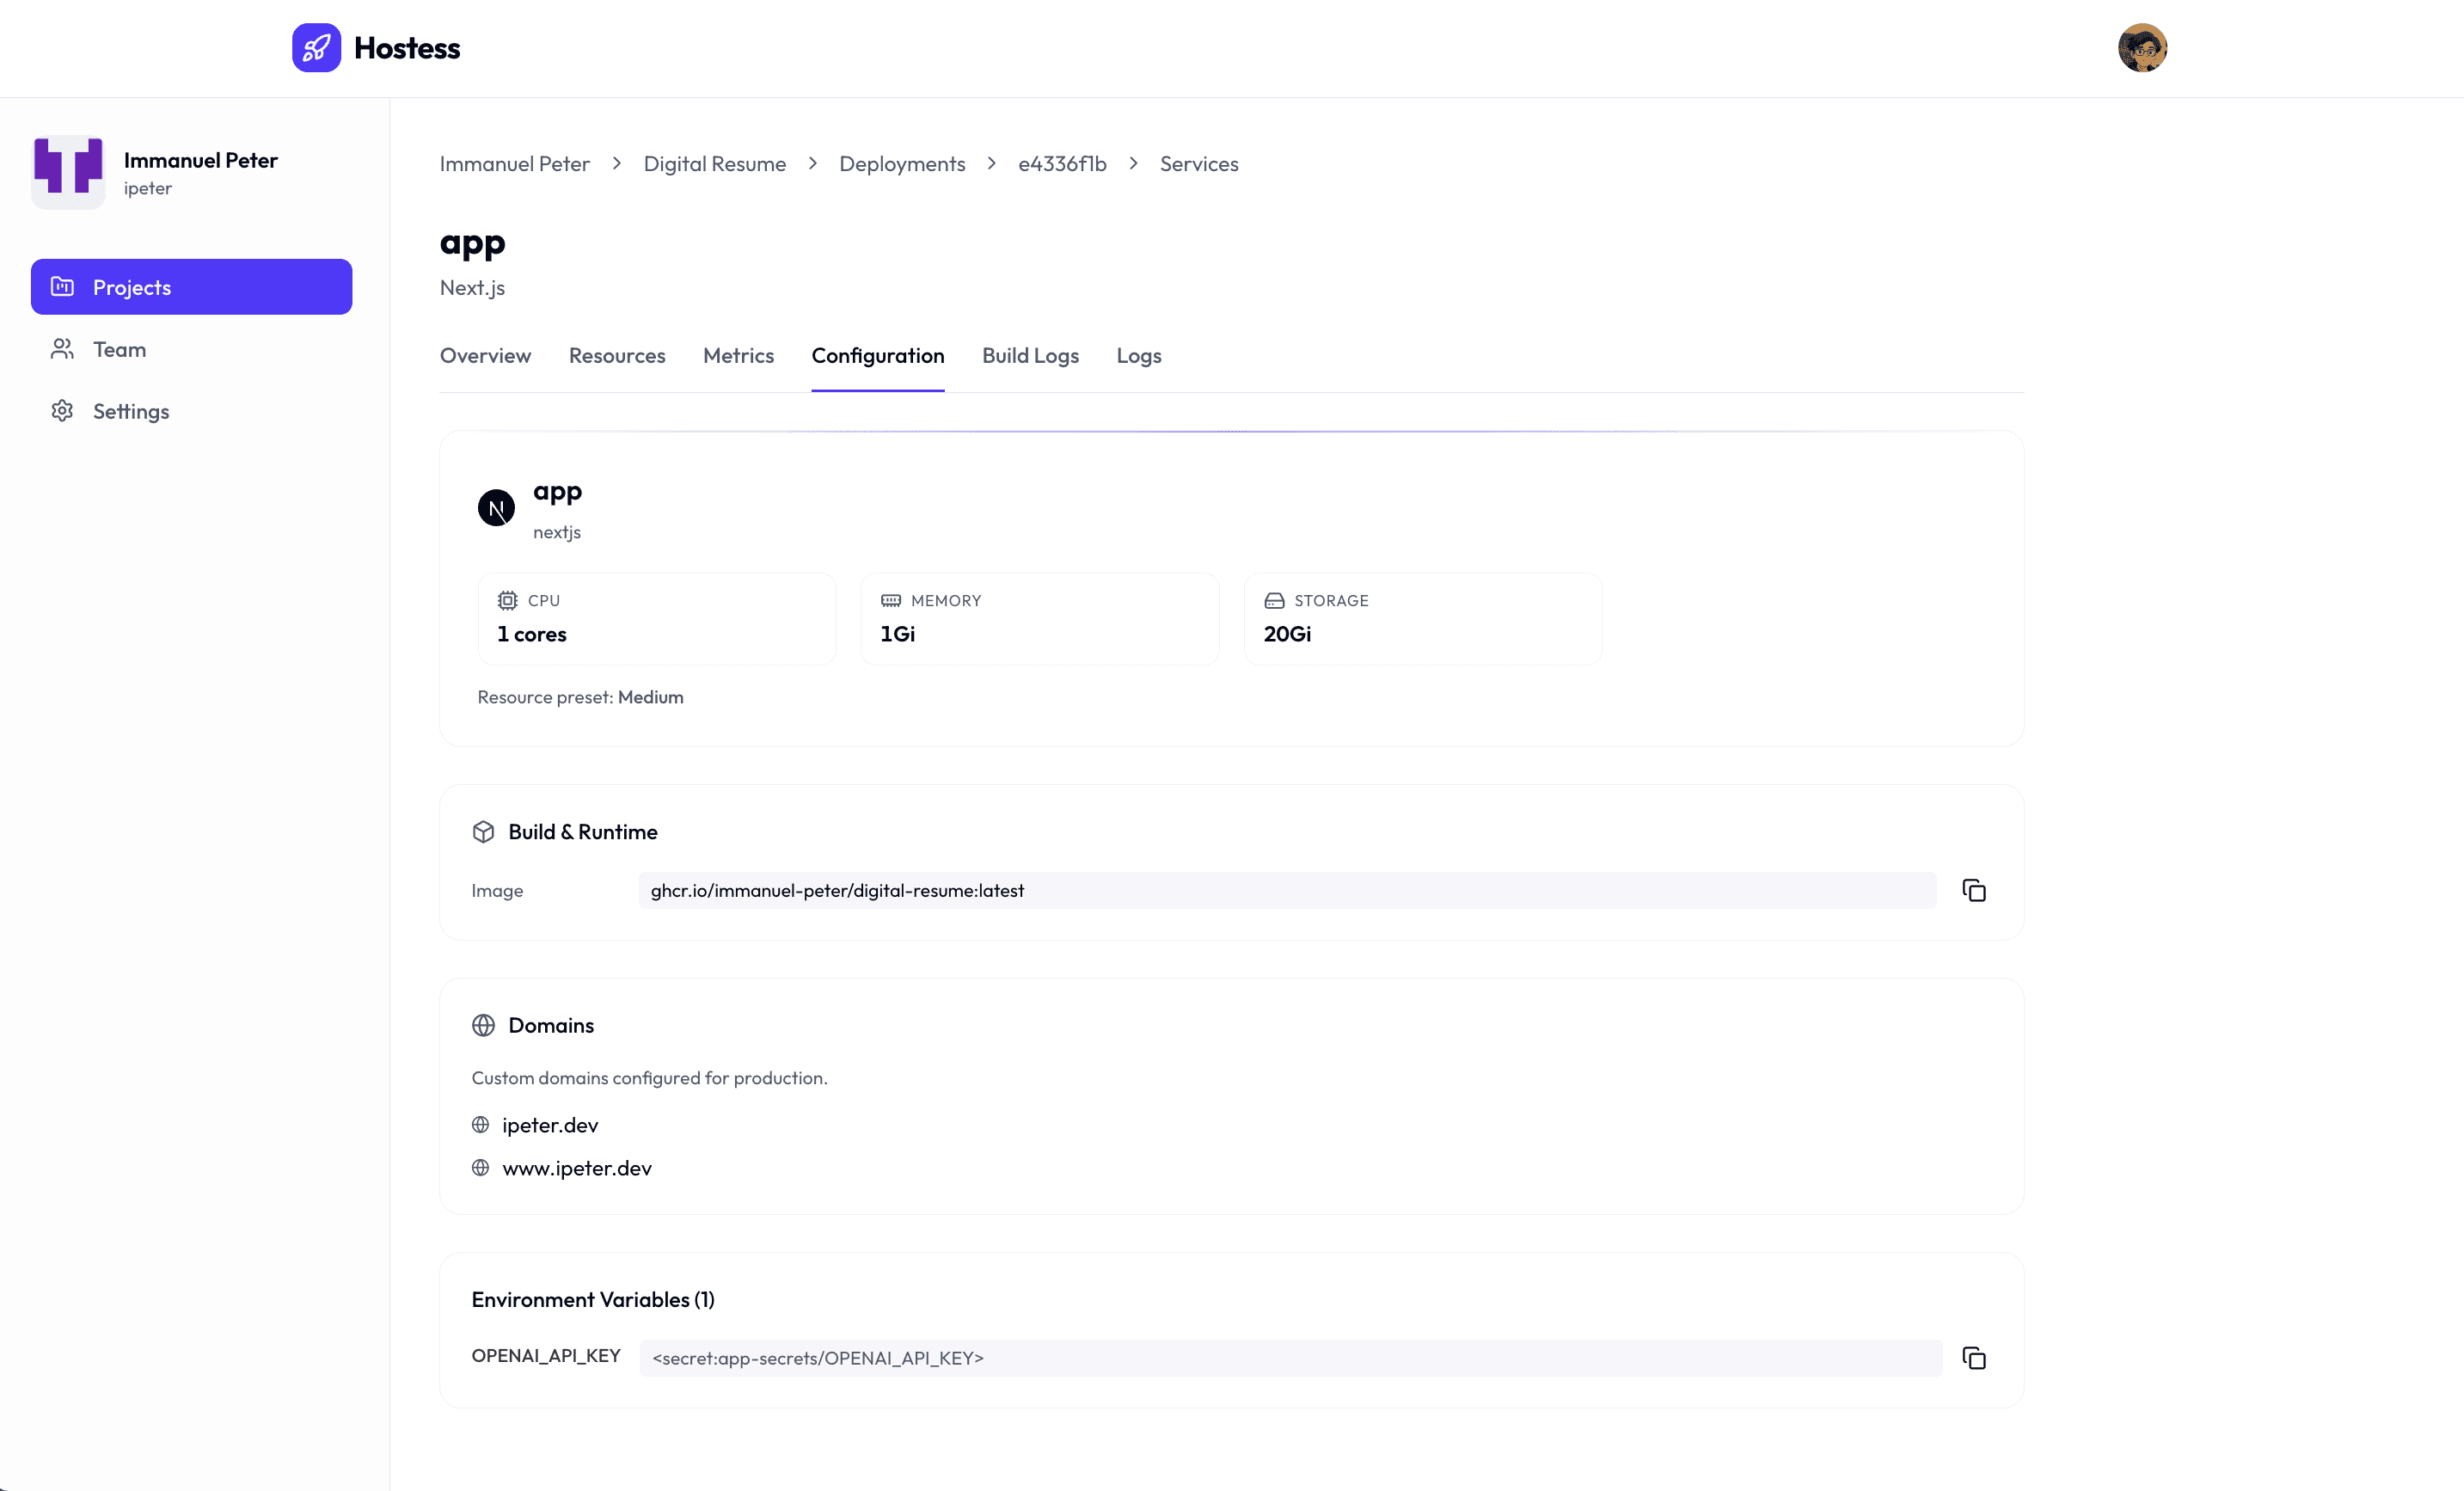
- Service identity — Service name, type, and type icon.
- Resources and scale — CPU, memory, storage, replica count, and exposed ports when present.
- Build and runtime — Whether the service was built from source, uses an image, or has a custom command.
- Dependencies and domains — Dependency relationships and configured domains.
- Health and lifecycle — Health check and lifecycle hook status.
- Databases and persistence — Database groups, durable mounts, and retention settings.
- Environment variables — Environment variable names and values made available to Studio for the deployment.
Build Logs
The Build Logs tab shows captured build output for services built from source. You can refresh the log view, toggle auto-scroll, copy the output, and inspect the build status alongside the log text.
Database Management
Postgres and Redis services include type-specific Studio pages for connection guidance, data inspection, metrics, and backups.
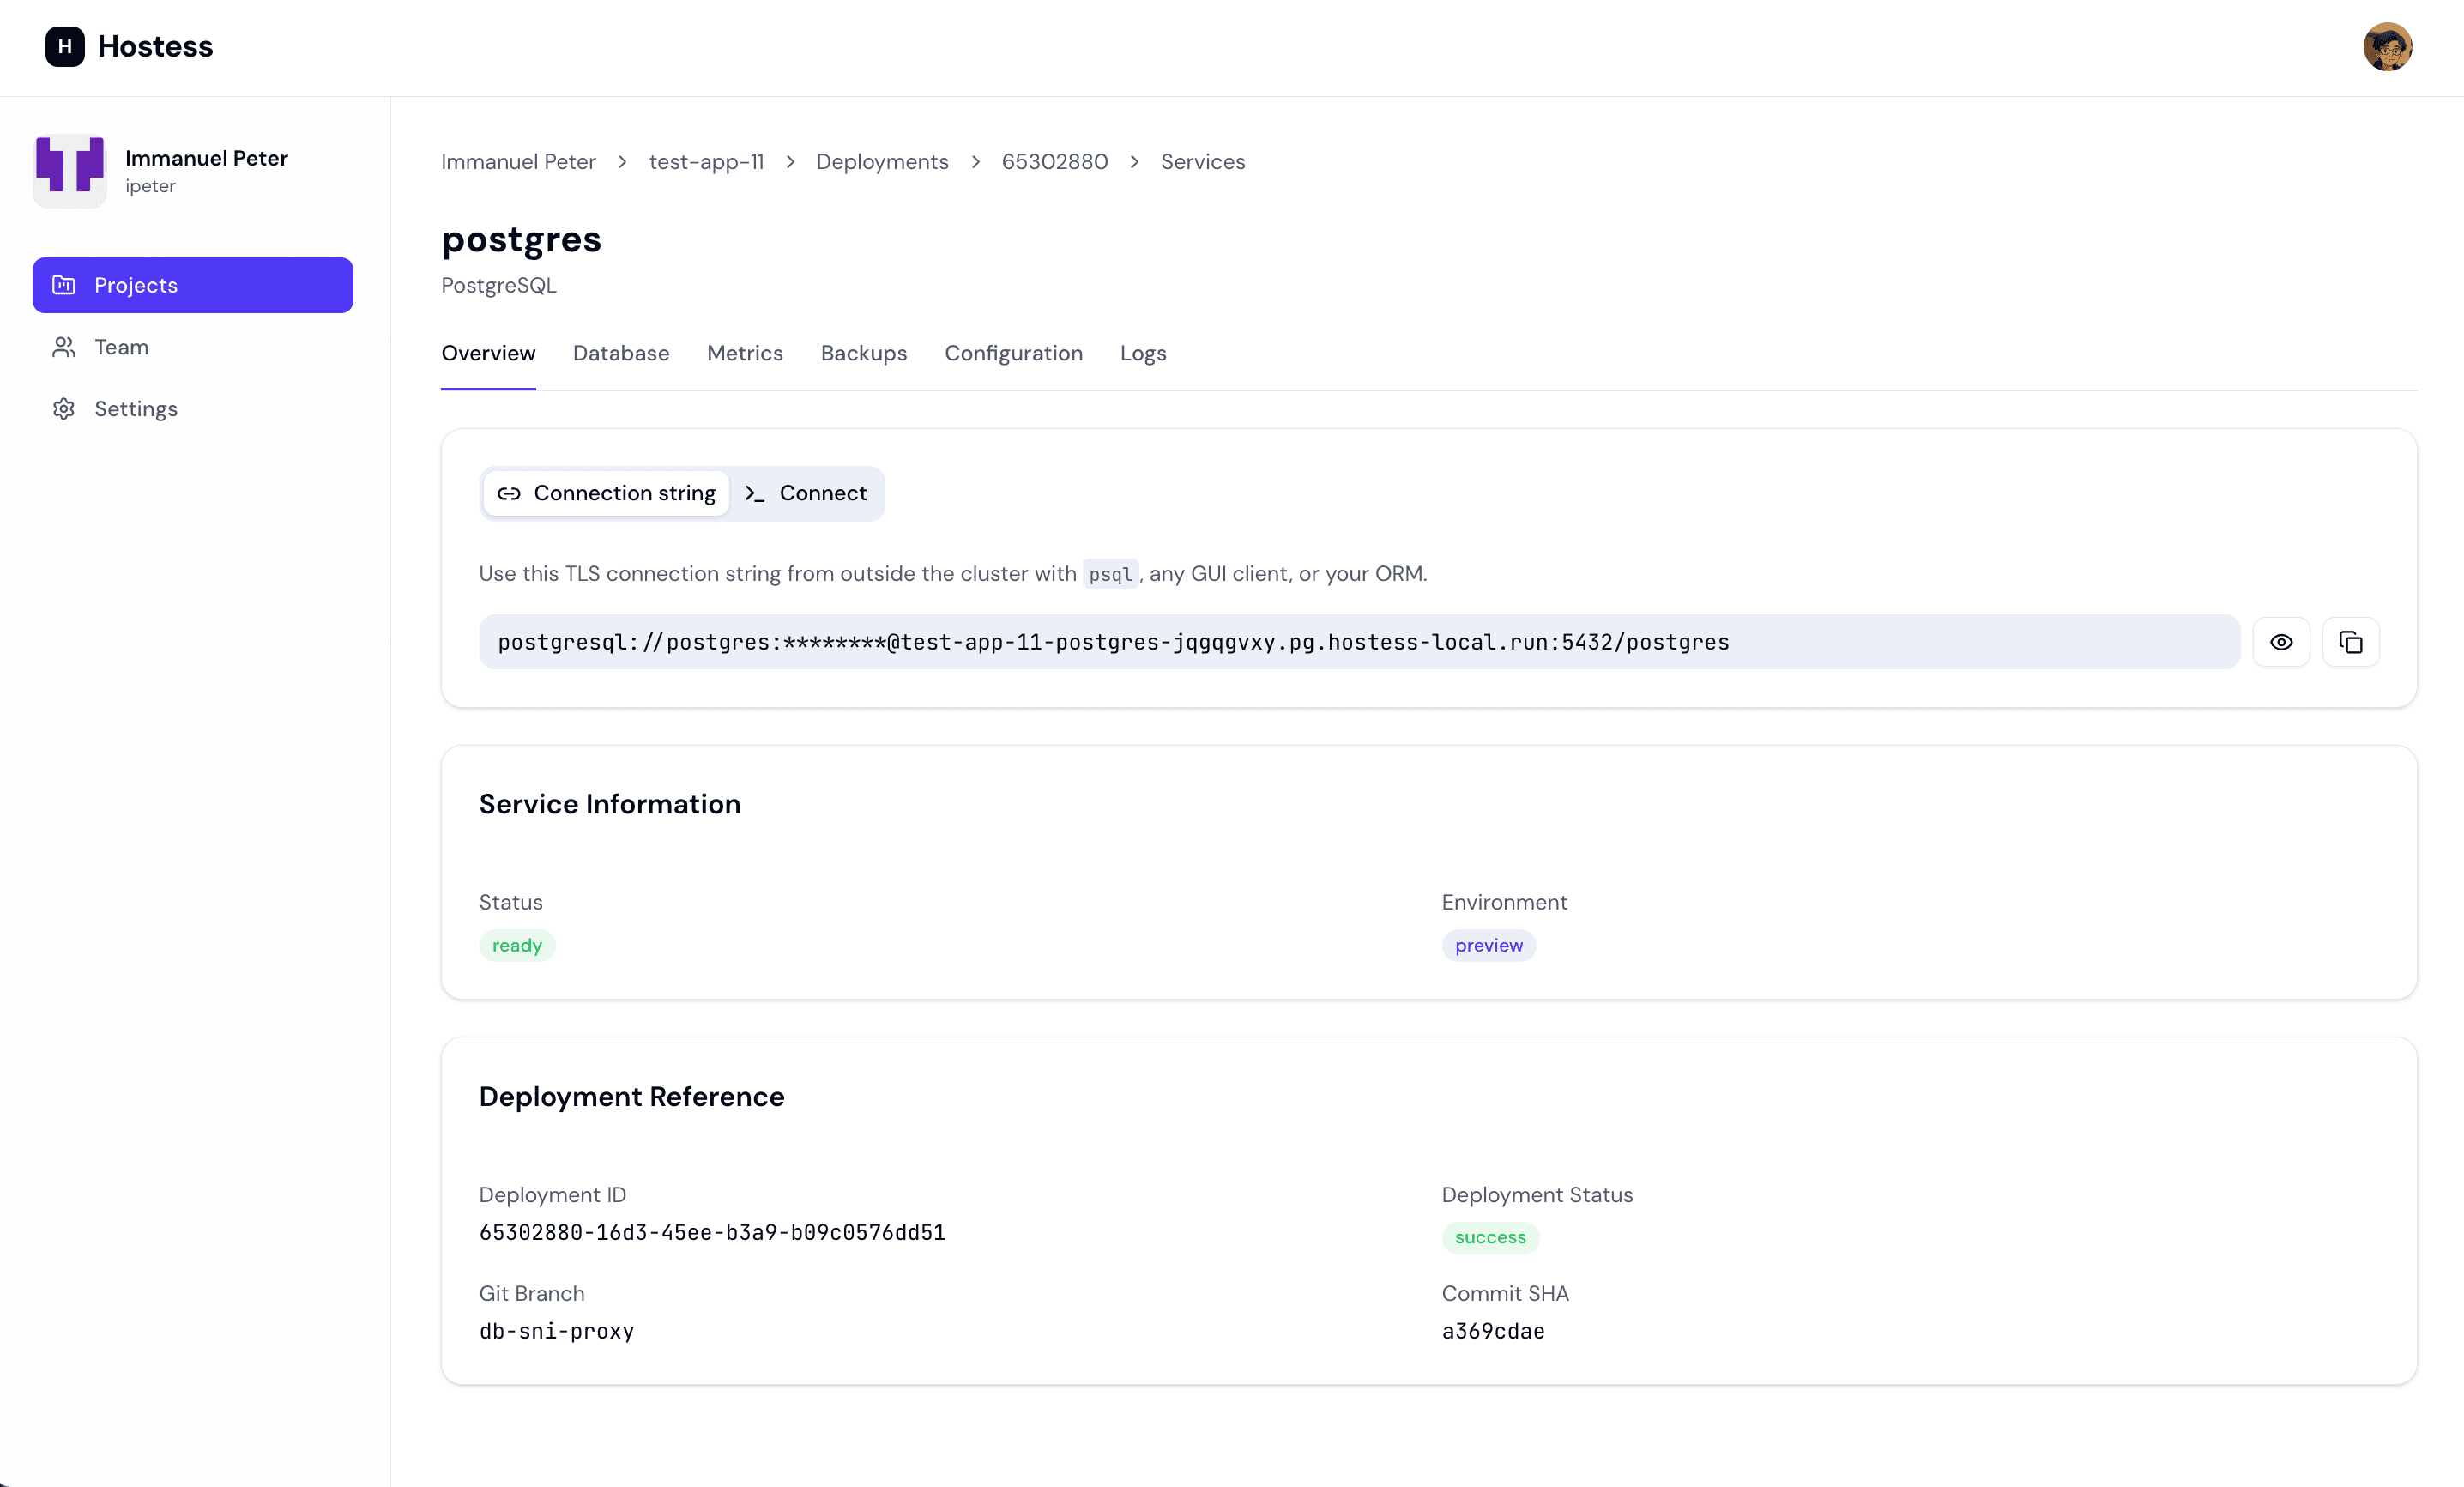
Connecting
The database service overview includes a Connection card with two tabs:
- Connection string — Public TLS connection URL for the service. Password is masked by default; use the reveal or copy button to grab it.
- Connect — The
hostess connectlocal port-forward flow, for when you'd rather tunnel from your machine:
# Connect to a Postgres database
hostess connect database

# Connect to a Redis instance
hostess connect cache
The CLI opens a local port-forward and prints the local address to use with psql, redis-cli, GUI clients, or application tooling. The connection stays open until you stop the command with Ctrl+C. See the CLI connect reference for details.
Database Groups
The database overview also shows scoped database group information when the service is configured for grouped consumers:
- Postgres groups — The group name, generated Postgres database name, and services that consume that group.
- Redis groups — The group name, Redis database index, and services that consume that group.
Postgres Database Browser
Postgres services include a Database tab for inspecting and editing database contents:
- Databases and schemas — Select a database and schema, then choose a table to inspect.
- Tables — Create and delete tables, and view table columns.
- Rows — Browse rows, add rows, edit rows, and delete rows.
- Columns — Add and delete columns from a selected table.
Redis Keys and Memory
Redis services include dedicated data and memory tools:
- Keys — Browse keys, search by pattern, inspect key values, and create keys.
- Memory — View memory usage, key counts, max memory, and eviction-policy information.
Metrics
Database metrics are shown on the Metrics tab:
- Postgres — Connection pool usage, performance metrics, storage by database, and replication status.
- Redis — Command volume, connected clients, memory usage, and keyspace statistics.
Backups
The Backups tab lists available backup objects and supports service backup workflows:
- Manual backups — Start a new backup from Studio.
- Backup list — Review backup filename, creation time, size, and trigger.
- Restore — Restore from a selected backup when automated restore is available for the service.
- Delete — Remove old backup files from object storage.
Secrets Management
The Secrets page provides an environment-scoped interface for managing encrypted project secrets. Navigate to Secrets in the project sidebar, then choose the environment you want to inspect or update.
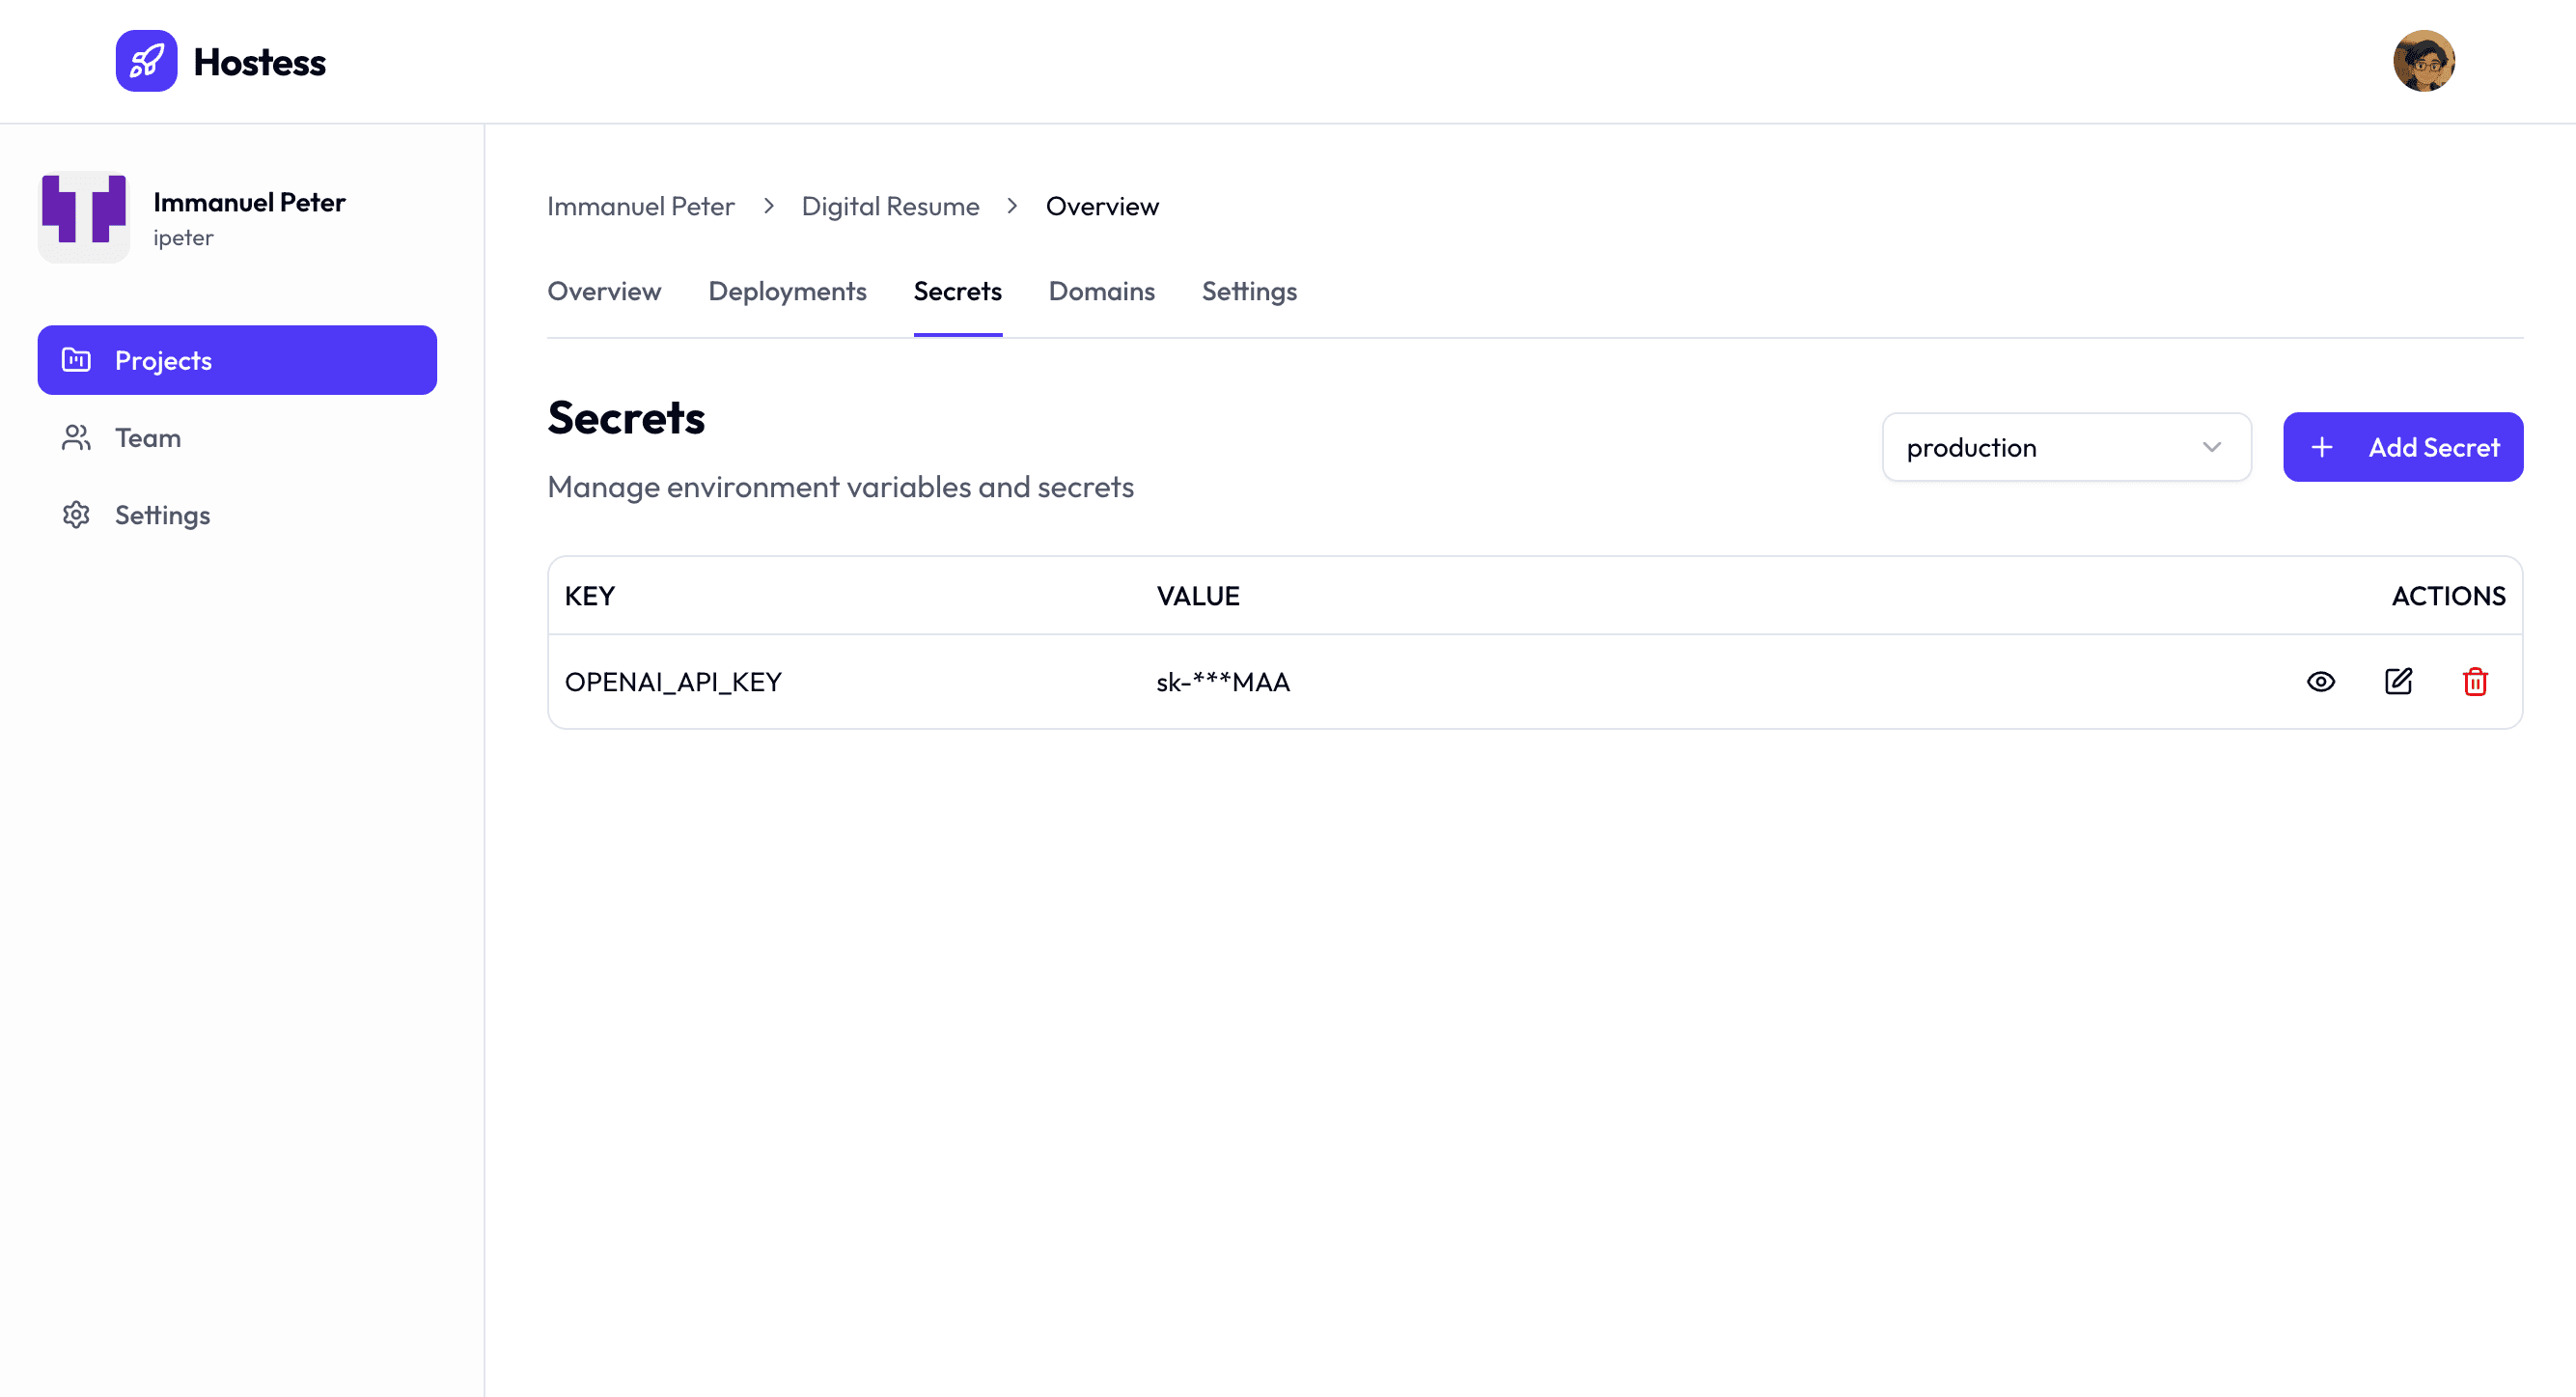
Viewing Secrets
The secrets table displays secrets for the selected environment:
- Key — The secret key name (e.g.,
JWT_SECRET,STRIPE_API_KEY). - Value — The secret value, masked by default. Owners and developers can reveal and hide values.
- Actions — Reveal, edit, and delete controls for the selected secret.
Use the environment selector at the top of the page to switch between environments. Each environment has its own secret set.
Adding a Secret
- Click the Add Secret button.
- Enter the secret name (e.g.,
STRIPE_API_KEY). - Enter the secret value.
- Click Add Secret.
Editing a Secret
- Find the secret in the list.
- Click the edit icon.
- Enter the new value.
- Click Update Secret.
After editing a secret, you need to redeploy for the change to take effect. The next hostess deploy will pick up the updated value.
Deleting a Secret
- Find the secret in the list.
- Click the Delete icon.
- Confirm the deletion in the dialog.
Deleting a secret removes it from the selected environment. If a service in that environment still references the deleted secret via ${secret:NAME}, the next deployment will fail with an error telling you which secret is missing.
Jobs
The Jobs page on a deployment shows top-level jobs: entries declared in hostess.yml.
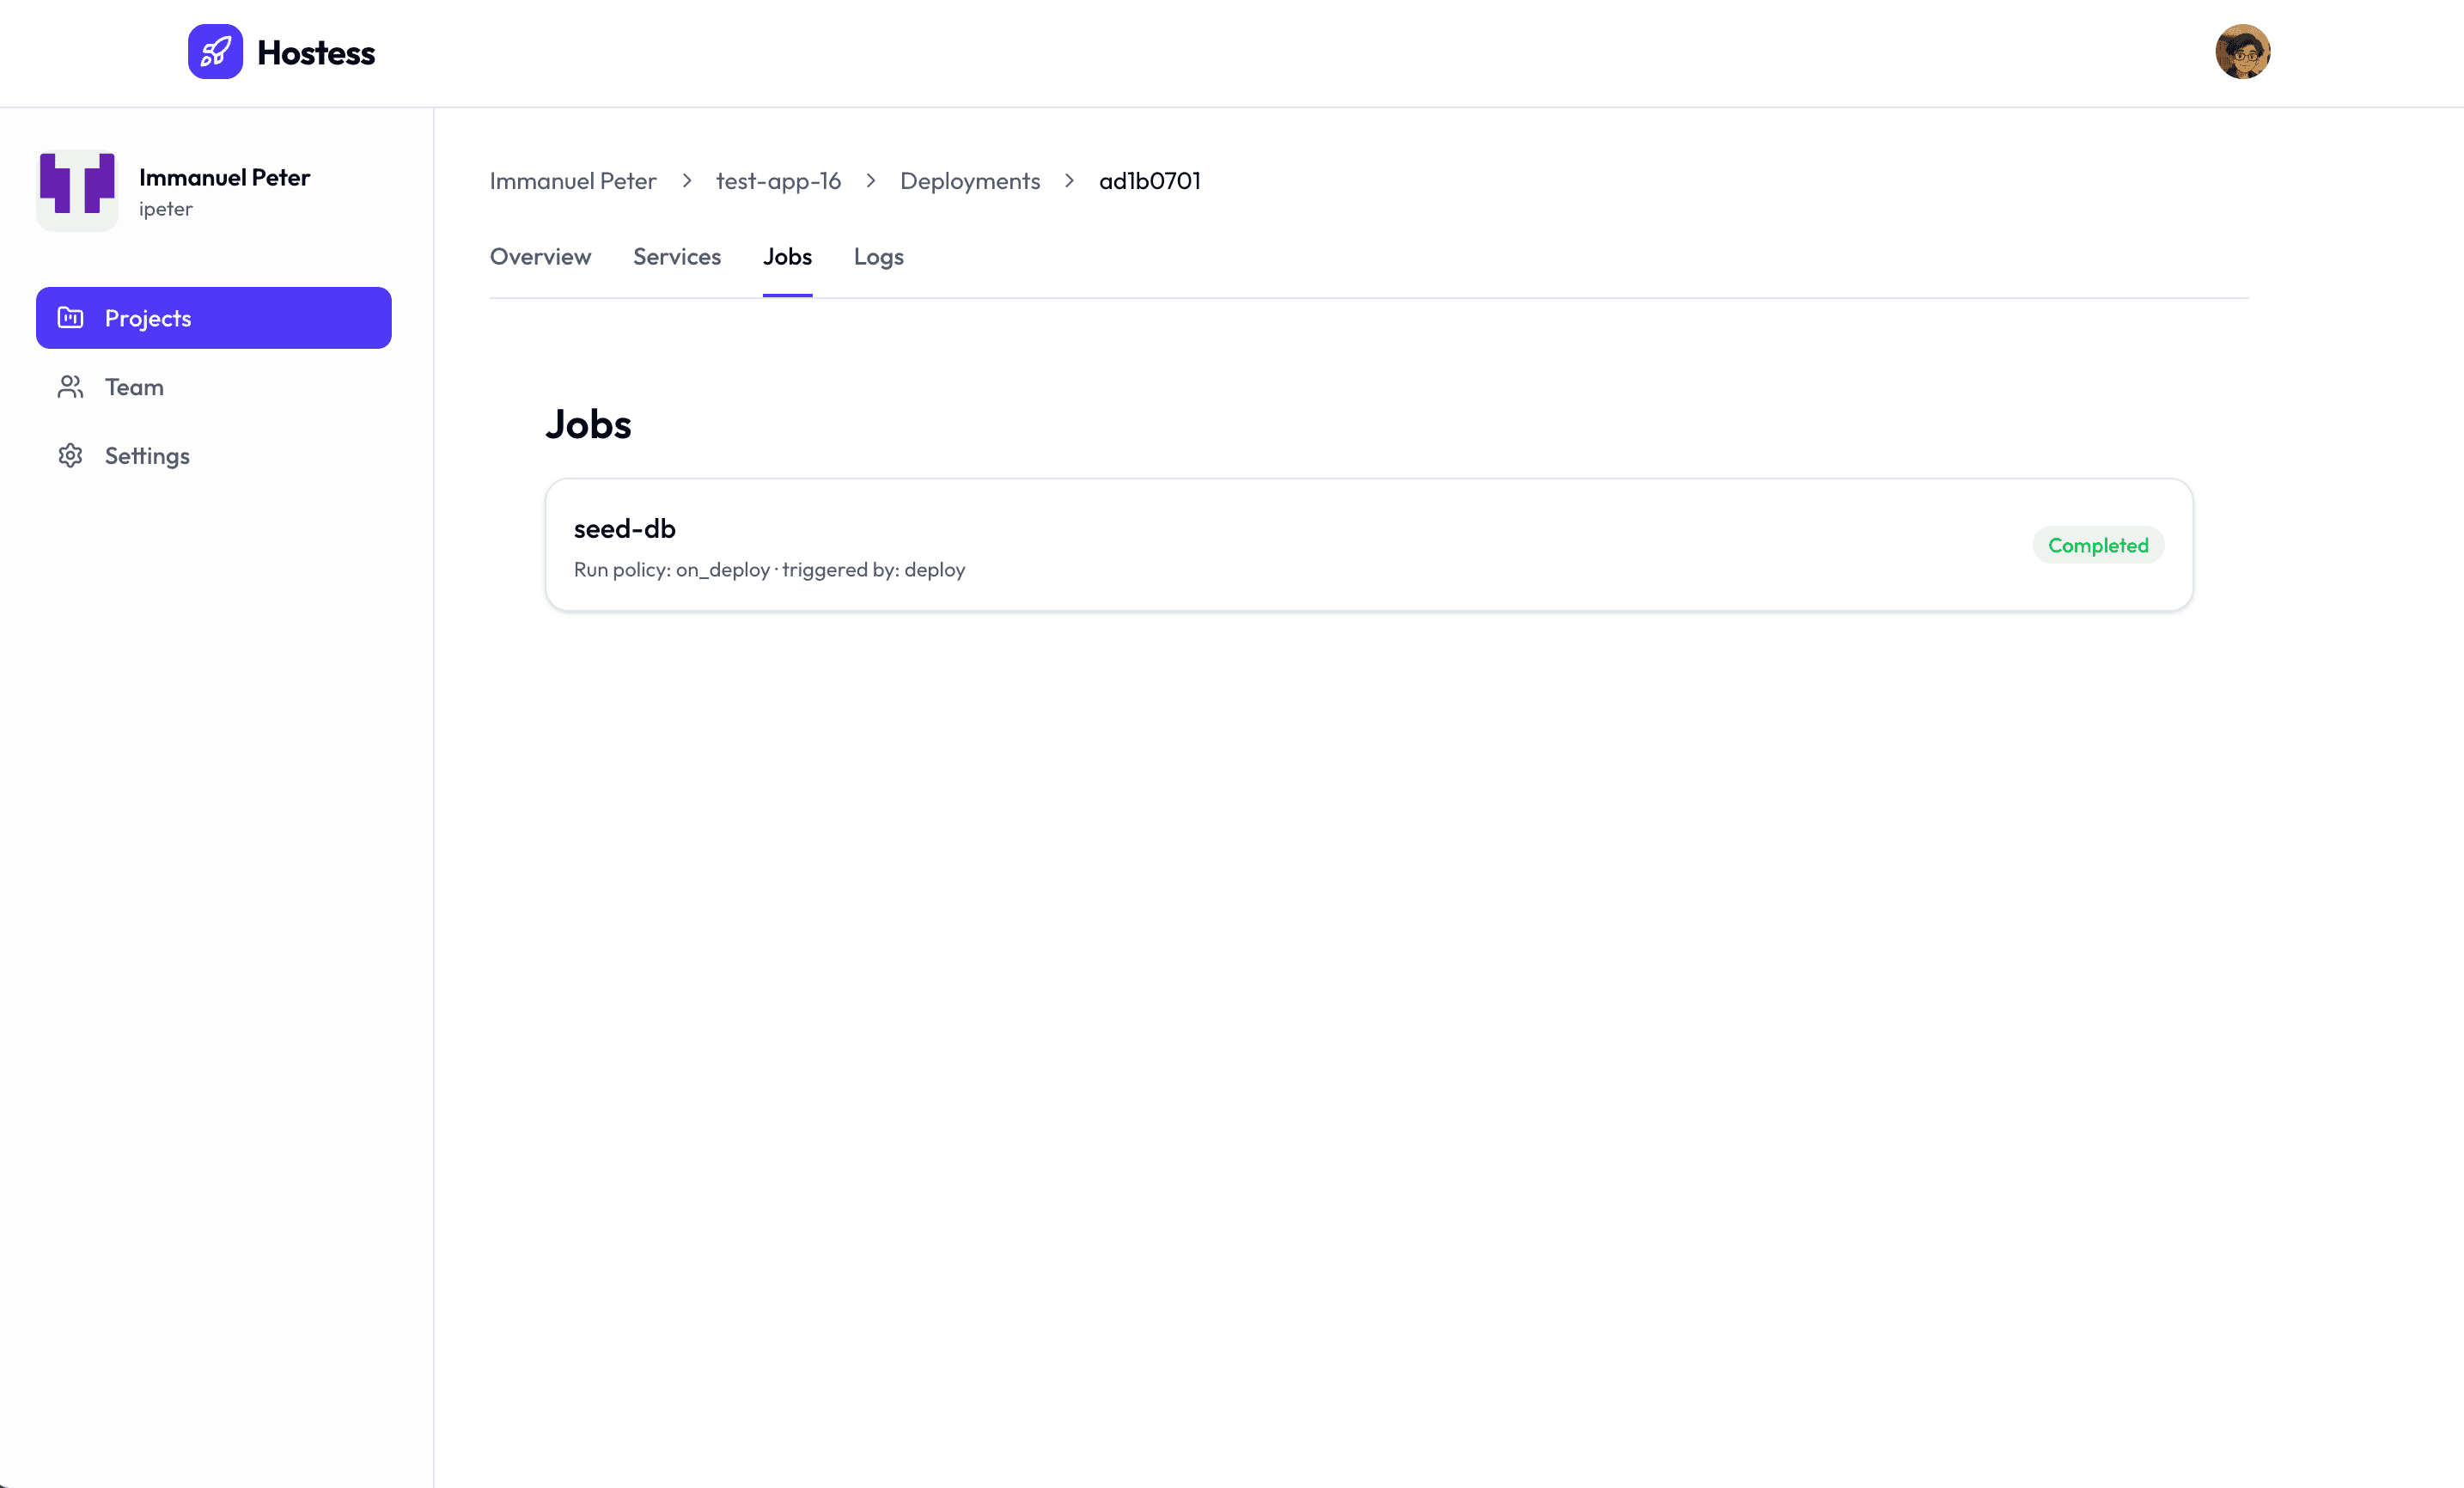
- Job list — Job name, run policy, schedule when present, trigger source when present, current status, failure message, and skipped reason.
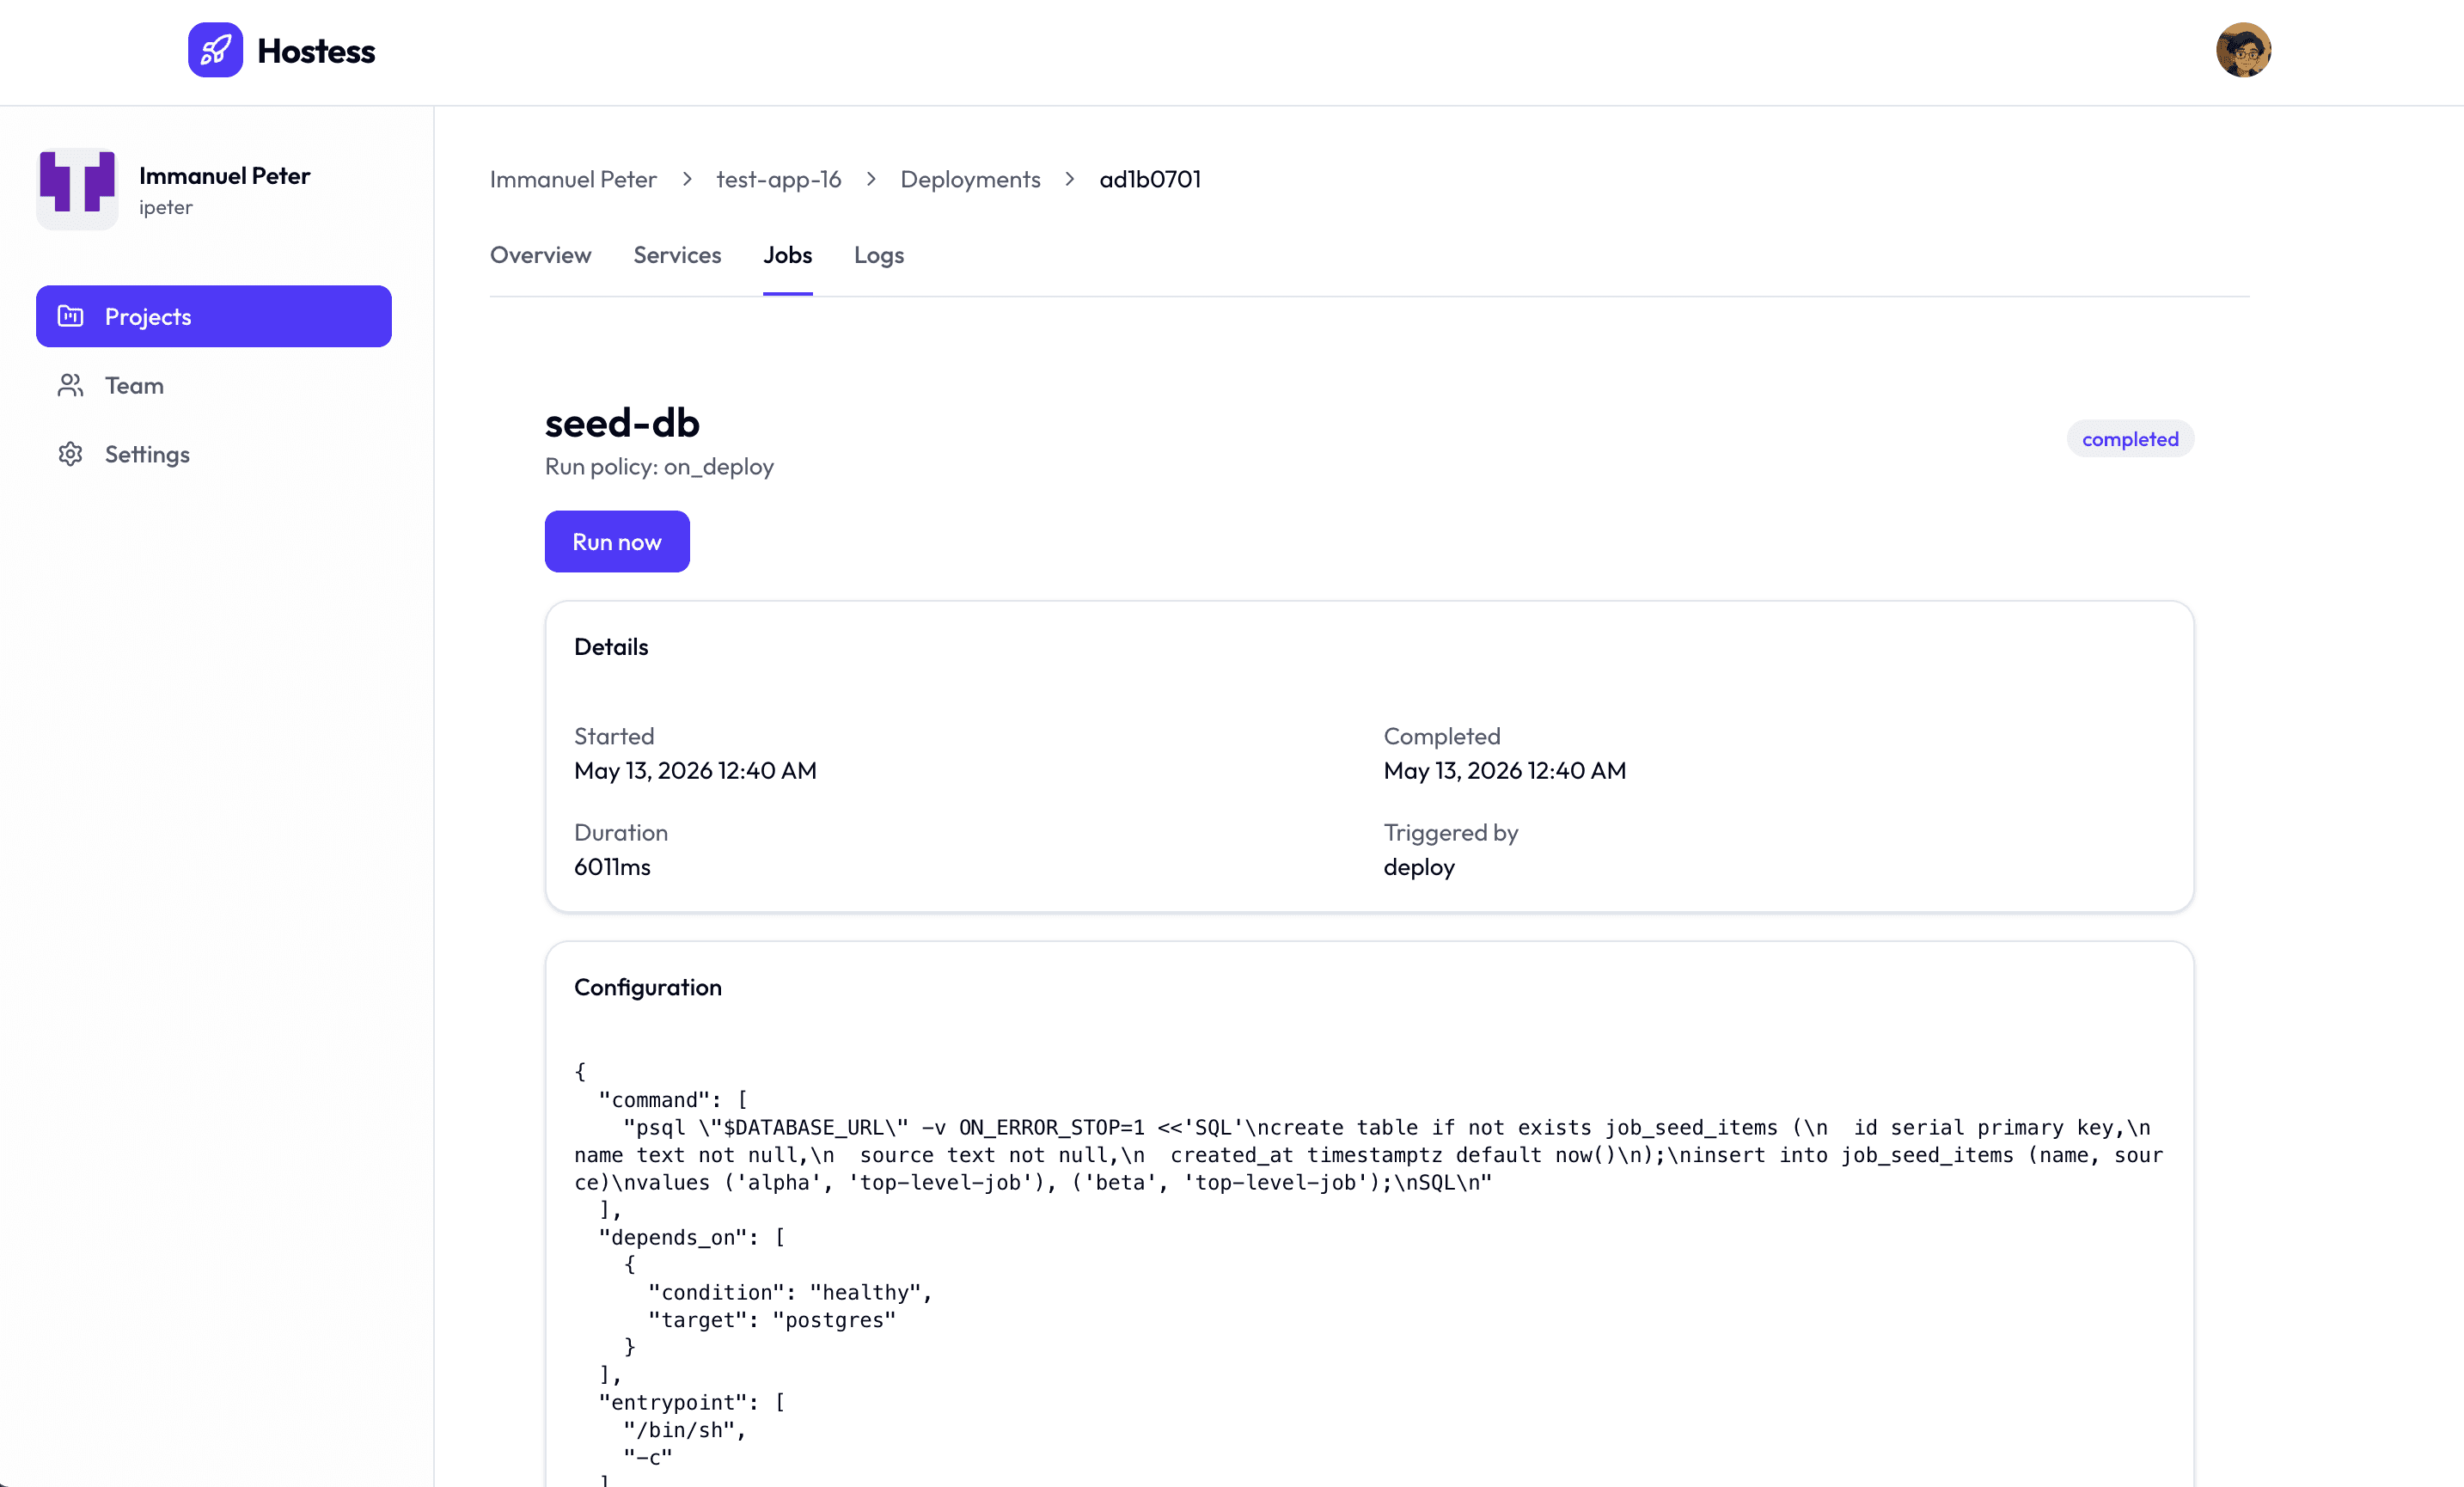
- Job detail — Status, run policy, started and completed timestamps, duration, schedule, last fire, next fire, and trigger source when those fields are available.
- Configuration — The job definition rendered as formatted JSON when configuration details are available.
- Controls — Owners and developers can run eligible jobs immediately and mark completed
oncejobs to run on the next deploy. - Logs — The job detail page streams the run's logs live, with search, pause, auto-scroll, and download. Cron jobs get a run picker to view logs from individual fires. Logs are persisted when a run finishes, so past runs — including old cron fires — remain viewable after their workloads are cleaned up. Viewing logs requires a role with log access.
Custom Domains
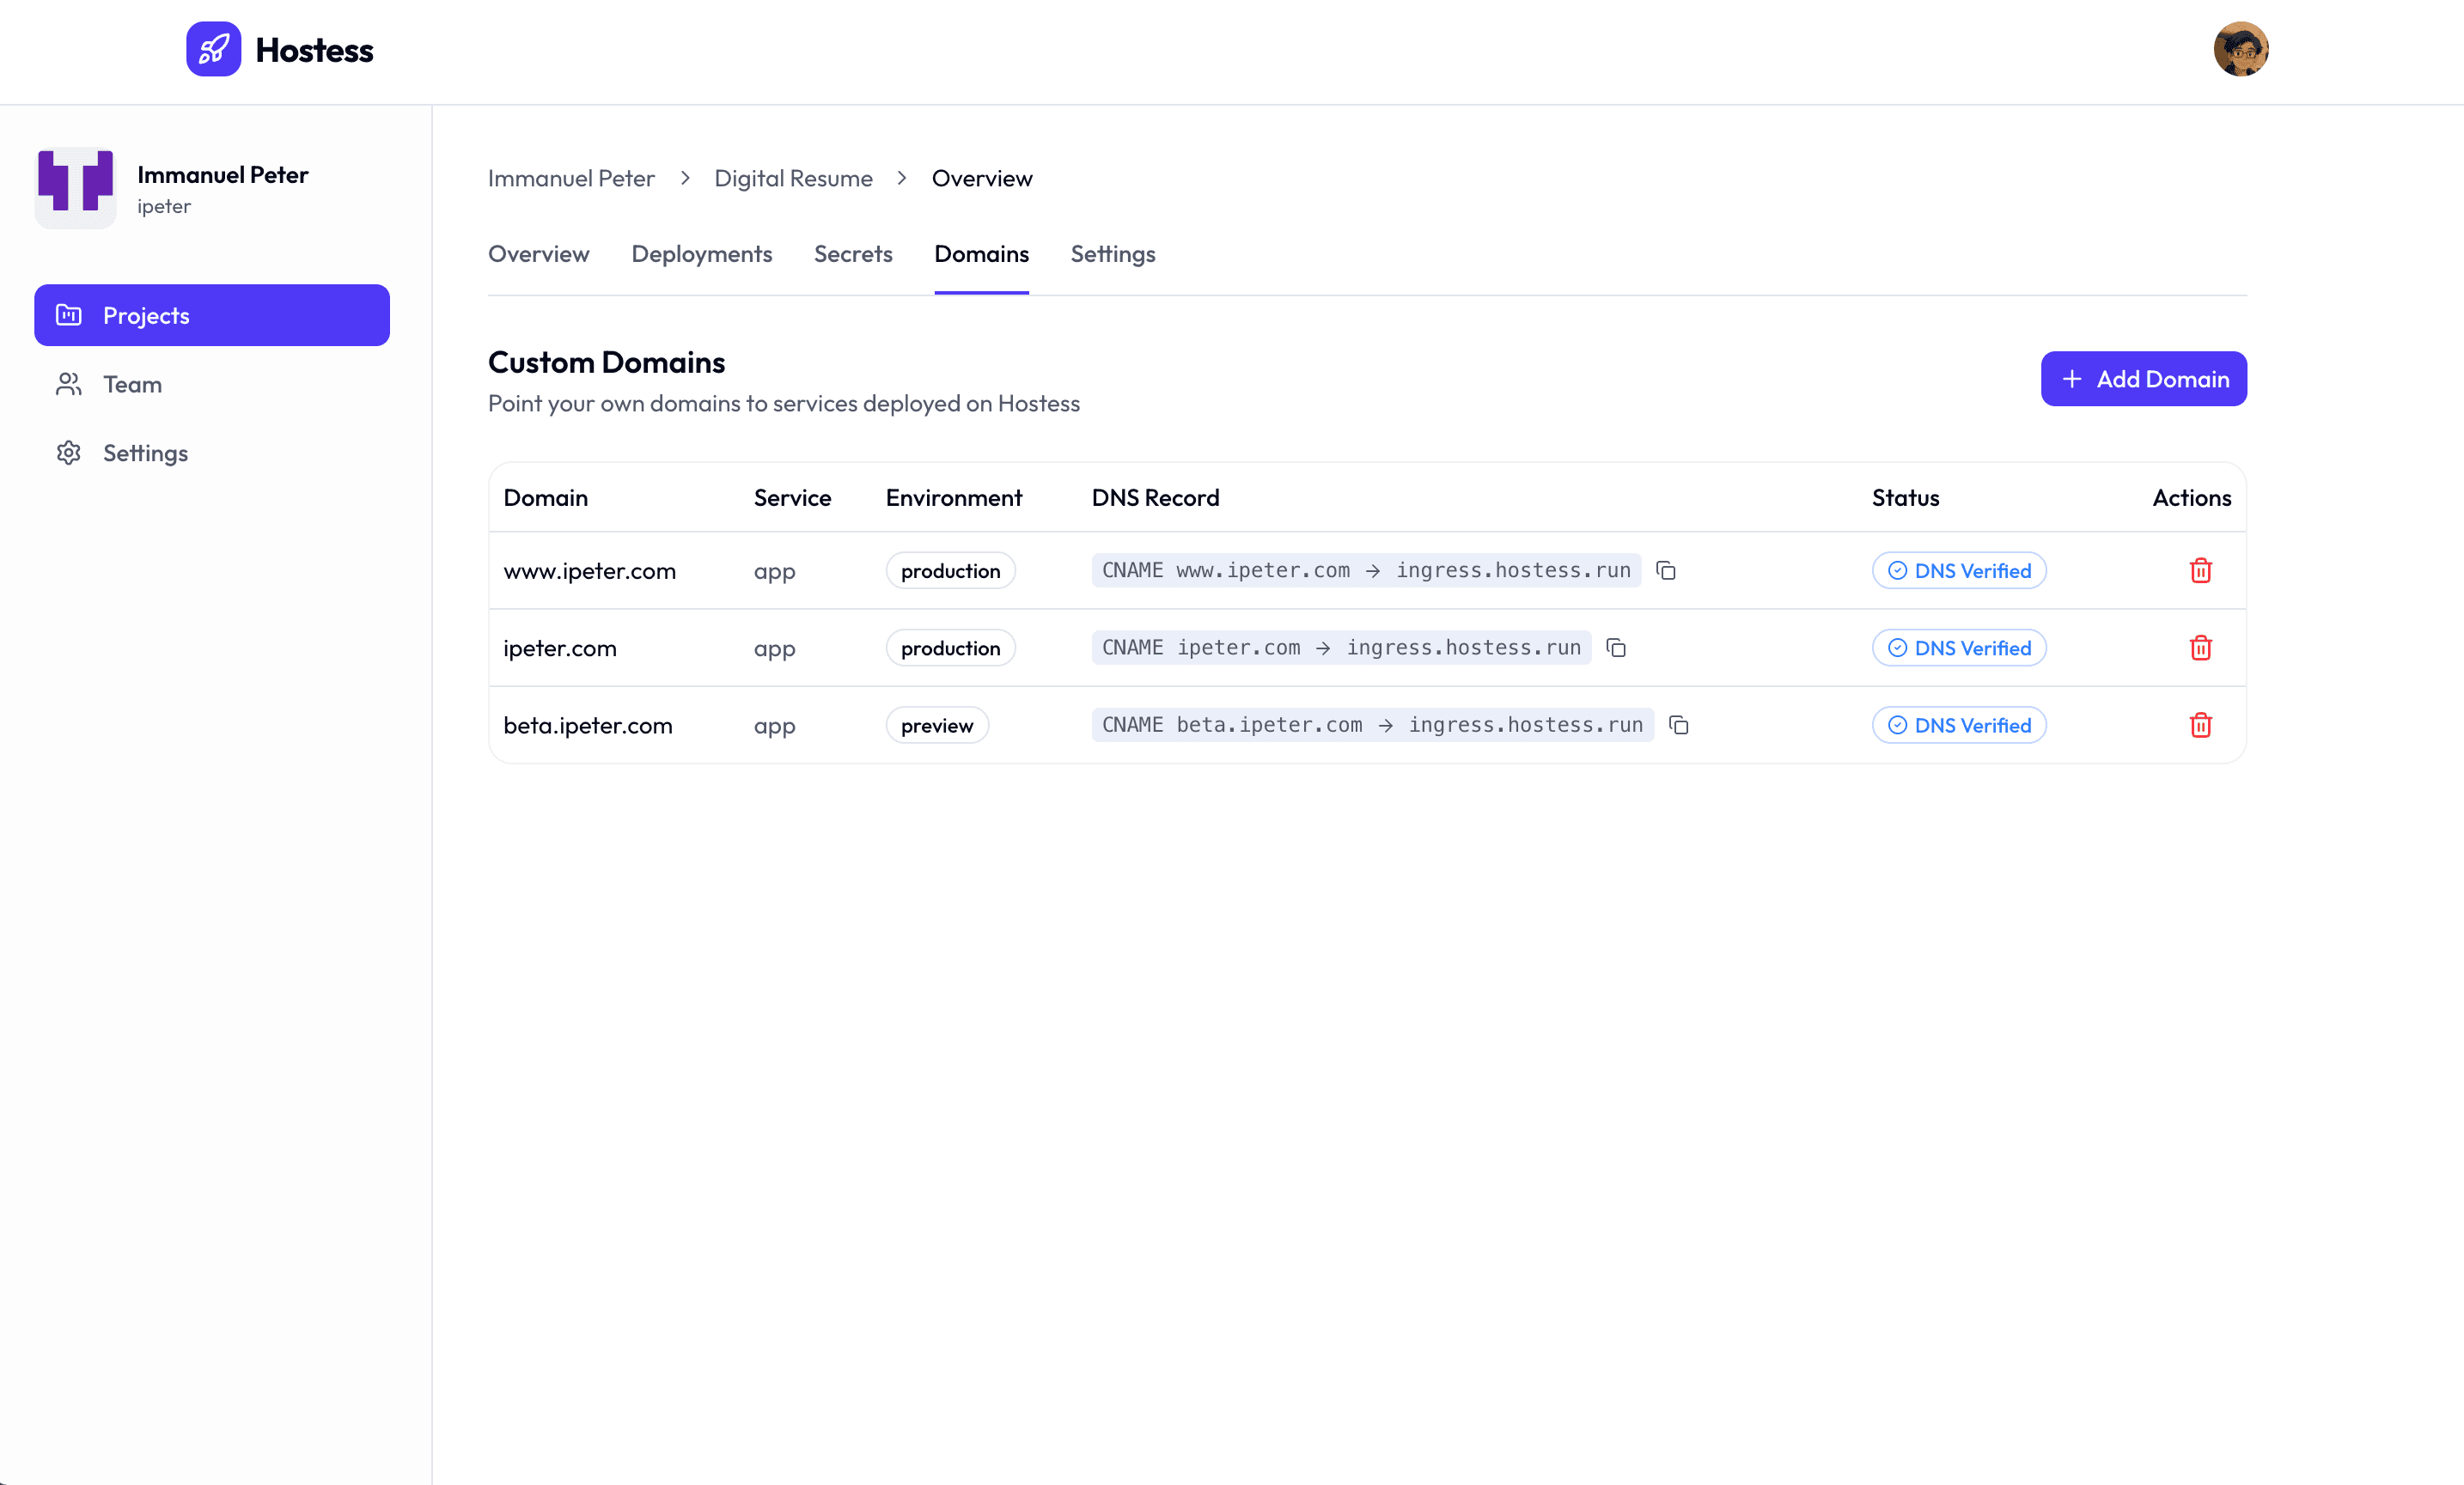
The Domains page lets you manage custom domains for your services. Navigate to Domains in the project sidebar.
Domain List
The domains table shows all custom domains configured for your project:
- Domain — The domain name (e.g.,
myapp.com,api.myapp.com). - Service — Which service the domain routes to.
- Environment — Which environment the domain is active in.
- DNS Record — The DNS record to configure, with a copy action for the CNAME target.
- Status — The current domain state, such as Pending DNS, DNS Verified, Active, or Failed.
- Actions — Verify pending DNS configuration, edit the domain's target, or remove the domain.
Adding a Domain
To add a custom domain in Studio:
- Click Add Domain.
- Enter the domain name (e.g.,
app.example.com). - Select the service the domain should route to.
- Select the environment. The dialog preselects production when it is available.
- Click Add Domain.
Traffic routes to the target service immediately — no redeploy needed. If the service hasn't been deployed to that environment yet, Studio tells you the domain will take effect on its next deploy. After adding the domain, use the DNS record shown in the DNS Record column:
CNAME app.example.com → <CNAME target shown in Studio>You can also configure domains in your hostess.yml file using the domains field on services or the environments section. See Custom Domains for the full guide.
Editing a Domain
Click the pencil icon next to a domain to change which service and environment it routes to. Routing updates immediately, and DNS verification carries over — you won't need to re-verify. The hostname itself can't be changed here; remove the domain and add the new one instead.
DNS Verification
Use the Verify action to check whether your DNS record is configured correctly. The status badge shows the result:
- Pending DNS — The CNAME record has not been verified yet.
- DNS Verified — The CNAME record points to the expected target.
- Failed — Verification did not succeed.
SSL Certificate Status
Once DNS is verified, Hostess provisions TLS for the domain. The domain status updates as setup progresses:
- DNS Verified — DNS is correct and the domain is ready for certificate setup.
- Active — The domain is serving over HTTPS.
Backups
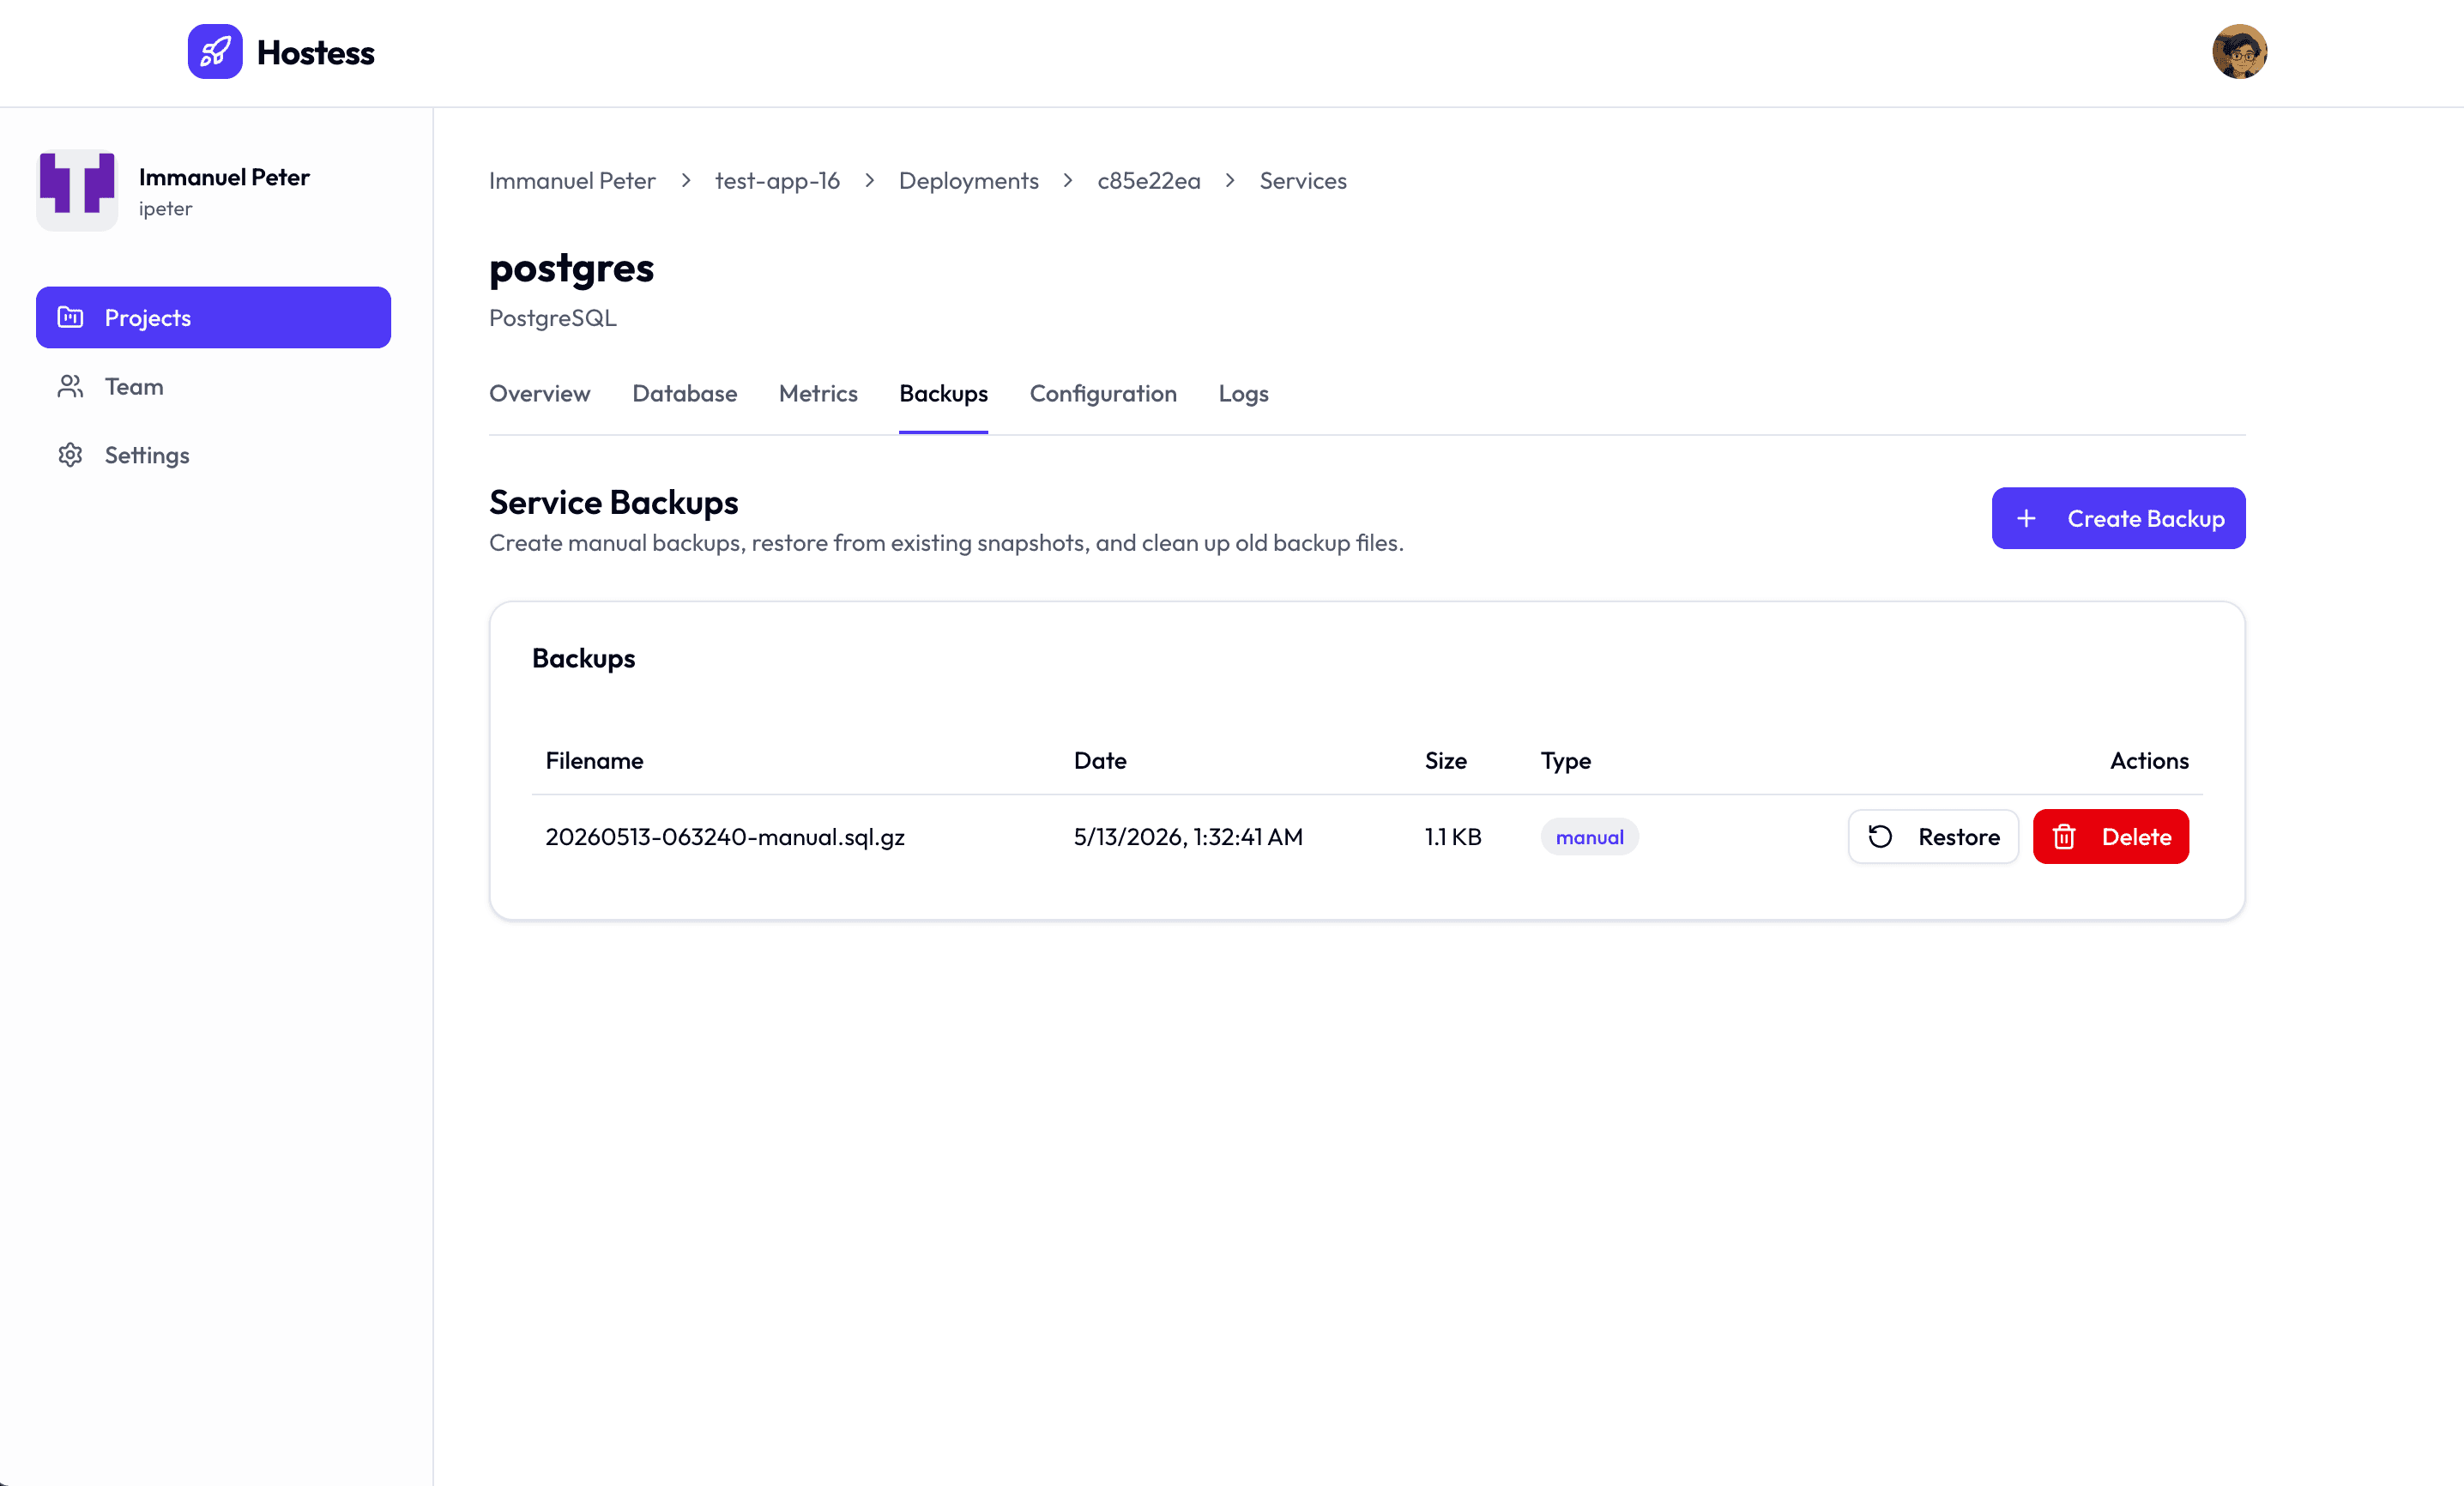
The Backups page lets you review stored backup files, start manual backup jobs, restore from existing snapshots, and delete old backup files. The Backups tab appears for Postgres and Redis services, and for custom services with backup configuration.
Viewing Backup History
The backup table shows the stored backup files for the selected service:
- Filename — The backup file name in object storage.
- Date — When the backup file was created.
- Size — The size of the backup file.
- Type — The backup trigger, such as
manualor a scheduled backup. - Actions — Restore or delete controls for the backup file.
Creating a Manual Backup
To create a backup on demand:
- Navigate to the Backups tab for the service.
- Click Create Backup.
Studio starts a manual backup job immediately. When the backup upload finishes, the new backup file appears in the backup list.
Restoring from a Backup
To restore from a previous backup:
- Find the backup you want to restore from in the history list.
- Click the Restore button next to it.
- Confirm the restore action in the dialog.
Restoring from a backup overwrites the current data for the service. Hostess creates a safety pre-restore backup automatically before the restore starts.
For Redis services, restore may include a brief restart while backup data is written.
Backup Configuration
Backup schedules are configured in your hostess.yml file. Edit the backup schedule in configuration, redeploy, and use Studio to view backup files, start manual backups, restore snapshots, and clean up old files. See the Configuration Reference for backup configuration options.
Navigation Reference
Here is a summary of the main pages and where to find them in Studio:
| Page | Location | Description |
|---|---|---|
| Organizations | Dashboard home | List of all organizations you belong to |
| Organization Overview | /org/{slug} | Projects list, team member count |
| Team | /org/{slug}/team | Member management, invitations, roles |
| Organization Settings | /org/{slug}/settings | Organization name, description |
| Project Dashboard | /org/{slug}/projects/{id} | Deployments, services, domains overview |
| Deployments | /org/{slug}/projects/{id}/deployments | Deployment history, cancel and delete controls |
| Deployment Detail | /org/{slug}/projects/{id}/deployments/{id} | Service statuses, build logs, URLs |
| Environments | /org/{slug}/projects/{id}/environments | Environment cards, live services, TTL, and CRUD |
| Service Detail | .../deployments/{id}/services/{id} | Logs, metrics, configuration, connections |
| Deployment Jobs | .../deployments/{id}/jobs | Top-level job statuses and run history |
| Job Detail | .../deployments/{id}/jobs/{id} | Job overview, logs, runs, build logs, and configuration |
| Secrets | /org/{slug}/projects/{id}/secrets | Secret management with masking |
| Domains | /org/{slug}/projects/{id}/domains | Custom domain management and DNS status |
| Backups | .../services/{id}/backups | Backup history, manual backup, and restore controls |
| Project Settings | /org/{slug}/projects/{id}/settings | Project name, description, deletion |
| Project Logs | /org/{slug}/projects/{id}/logs | Aggregated logs across all services |